

Key Highlights
- Ethereum price failed once again to trade near the $15.00 level vs the US dollar and moved down.
- Yesterday’s highlighted bullish trend line on the hourly chart (data feed via Kraken) of ETH/USD was broken during the downside drift.
- Two failures to trade and break $15.00 suggests that the price is starting to feel the heat in the short term.
Ethereum price may trade down if the ETH/USD bulls fail once again to take it close to the $15.00 level moving ahead.
Ethereum Price to Weaken?
Ethereum price ETH yesterday attempted to trade higher, but failed to near the $14.40 level vs the US Dollar. I was hoping it to test at least the last swing high of $14.80. However, the ETH sellers had a different idea, as they managed to outpace the bulls and took the price down. Yesterday’s highlighted bullish trend line on the hourly chart (data feed via Kraken) of ETH/USD was breached to ignite a downside move.
The most important point is that the price has now registered two failures around the $14.50 level, which is a warning to the bulls that a top may be in place. However, there are many support levels on the downside for the price, which may act as a hurdle for sellers if it moves down from the current levels.
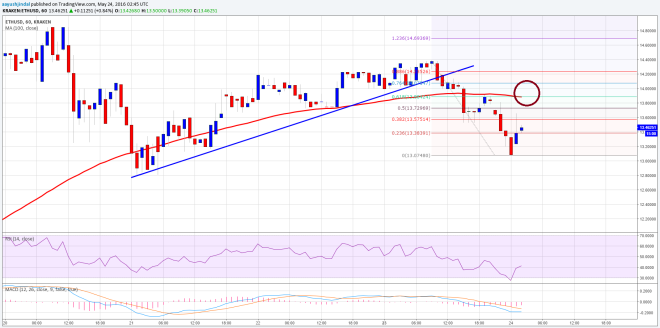

If the price moves higher, then an initial resistance is around the 38.2% Fib retracement level of the last drop from the $14.40 high to $13.07 low. However, the most important resistance is near the 100 hourly simple moving average, which is sitting along with the 50% Fib retracement level of the same drop. One may even consider selling near it with a stop above the 100 hourly SMA.
Hourly MACD – The MACD is in the bearish zone, which is a negative sign.
Hourly RSI – The RSI is below the 50 level, calling for more weakness in the near term.
Intraday Support Level – $13.10
Intraday Resistance Level – $14.00
Charts courtesy of Kraken via Trading View
Header Image via NewsBTC