Key Highlights
- Ethereum price surged higher against the US dollar and posted healthy gains during the past 24 hours.
- My yesterday’s idea of buying worked and it you entered a trade, then it’s time to take profits if not already.
- A new bullish trend line is formed on the hourly chart (data feed via SimpleFX) of ETH/USD, which can now act as a support area on the downside.
Ethereum price continued to gain traction against the US Dollar, and it looks like the idea of buying dips may still work in the short term.
Ethereum Price Buy
Ethereum price ETH climbed further higher against US Dollar, as yesterday’s highlighted short-term bullish trend line on the hourly chart (data feed via SimpleFX) of ETH/USD proved its worth in acting as a support. Moreover, my idea of buying dips worked perfectly, and I hope you enjoyed gains. I think it’s time to take profits it not already.
The price traded as high as $12.66 where it found sellers and started to correct lower. It already tested the 38.2% Fib retracement level of the last leg from the $10.85 low to $12.66 high. However, there is a new bullish trend line is formed on the hourly chart (data feed via SimpleFX) of ETH/USD, which can be considered as a major support area on the downside if the price corrects further.
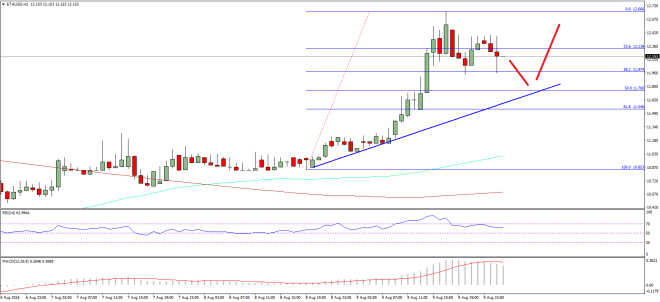

Lastly, the 50% Fib retracement level of the last leg from the $10.85 low to $12.66 high is also on the downside to act as a support zone. One may again consider entering a buy trade near the trend line support area with a stop below the same.
Hourly MACD – The MACD is well in the bullish zone, which is a positive sign.
Hourly RSI – The RSI is above the 50 level, suggesting that the bulls are in action.
Major Support Level – $12.00
Major Resistance Level – $12.50
Charts courtesy – SimpleFX