Key Highlights
- Ethereum price finally tested and broke my much anticipated target of $20.0 against the US Dollar.
- During my last couple of analysis, I highlighted that the price may test or even break the $20.0 resistance level in the short term.
- There was a resistance trend line on the hourly chart (data feed via Kraken) of ETH/USD, which was cleared recently to open the doors for more upsides.
Ethereum price finally broke $20.0, which is a sign that the ETH bulls are in control. Can it continue to trade higher or should we trade safe?
Ethereum Price Support
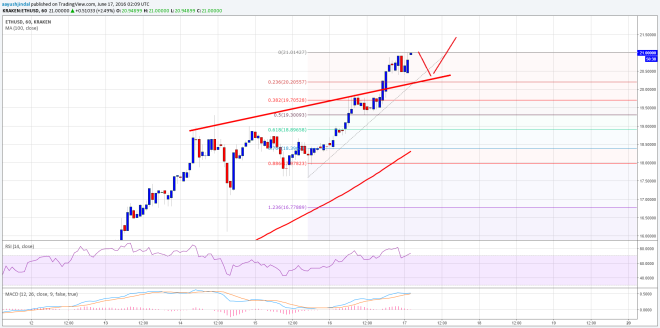
Ethereum price ETH continued to grind higher against the US Dollar, and managed to test plus break the all-important 20.00 level. I mentioned in my last few analysis that a test of the stated level is very likely, as there were a lot of bullish signs visible on the charts. ETH/USD popped higher intraday, and also broke a resistance trend line on the hourly chart (data feed via Kraken).
The price traded as high as $21.00 recently and currently consolidating gains. Can it continue to trade higher from the current levels? Yes, it is possible, but I would say one needs to trade safe as the price is now overextended. The broken resistance level of $20.0 may now act as a support area for ETH/USD.

However, I would not recommend any buy trade setup for some time now. No doubt, it may extend the rally further, but the technical indicators are now suggesting a caution in the near term. So, I think we should wait for a correction before planning for a trade.
Hourly MACD – The MACD may move into the bearish zone, calling a correction in ETH.
Hourly RSI – The RSI is around the overbought levels, which is not a good sign for the ETH bulls.
Major Support Level – $20.00
Major Resistance Level – $21.00
Charts courtesy of Kraken via Trading View