Key Highlights
- Ethereum price continued to struggle against the US Dollar and moved down further during the past few sessions.
- This past week’s highlighted bearish trend line on the hourly chart (data feed via Kraken) of ETH/USD proved worth and pushed the price down.
- The price traded close to the $11.20 support area where it found support and managed to correct higher.
Ethereum price after tumbling started to correct higher against the US Dollar, but I think the correction phase won’t last long.
Ethereum Price Downside Move
Ethereum price ETH continued to face offers against the US Dollar, and every major rally was sold aggressively. I mentioned this past week as well that the ETH/USD pair is under a bearish pressure and may extend the downside in the short term. The most important point is the fact that this past week’s highlighted bearish trend line on the hourly chart (data feed via Kraken) of ETH/USD played well in acting as a resistance and pushed the price down.
The hourly simple moving average also acted as a hurdle and protected an upside break. The price is currently correcting higher, but facing sellers near the 38.2% Fib retracement level of the last drop from the $12.79 high to $11.34 low. I think there is a chance of a spike higher so that the price tests the 50% retracement level of the same wave before it can resume the downtrend.
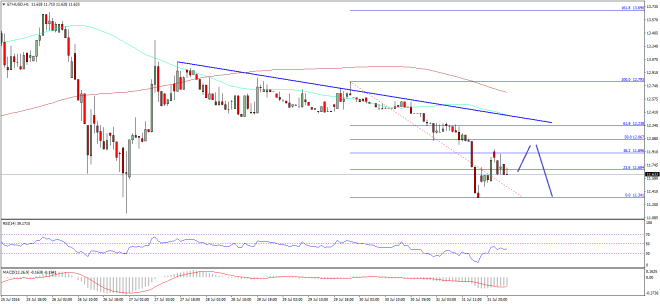

Since the price is now below the $11.80 support area I am turning negative on ETH/USD until I see a convincing recovery. On the downside, the next major support lies at $11.20, which can play a critical role moving ahead.
Hourly MACD – The MACD is in the bearish zone with no signs of a major recovery.
Hourly RSI – The RSI has recovered from the oversold readings, but remains below the 50 level.
Major Support Level – $11.20
Major Resistance Level – $12.00
Charts courtesy – SimpleFX