Key Highlights
- ETH price continued to challenge an important resistance area against the US Dollar, but failed to break it.
- There is a bearish trend line as highlighted yesterday on the hourly chart (data feed via SimpleFX) of ETH/USD, which is acting as a resistance.
- The pair is slowly stabilizing, and may attempt another break of the trend line resistance.
Ethereum price is currently trading below a resistance trend line and struggling to break it. If the ETH bulls succeed, it may call for an upside move.
Ethereum Price Hurdle
Ethereum price remained above a major support area against the US Dollar, and was seen trading in a range for most of the time. The ETH bulls attempted to take the price higher on a couple of occasions, but failed to take it above the $11.92 level. The most important hurdle on the upside for the buyers is around yesterday’s highlighted bearish trend line on the hourly chart (data feed via SimpleFX) of ETH/USD. It is acting as a monster resistance and preventing an upside move.
Moreover, the 61.8% Fib retracement level of the last drop from the $12.22 high to $11.46 low also acted as a resistance and stopped the upside move. The price is currently above the 100 hourly simple moving average, but it lacks momentum. I think the price may gain pace if there is a break above the highlighted trend line resistance.
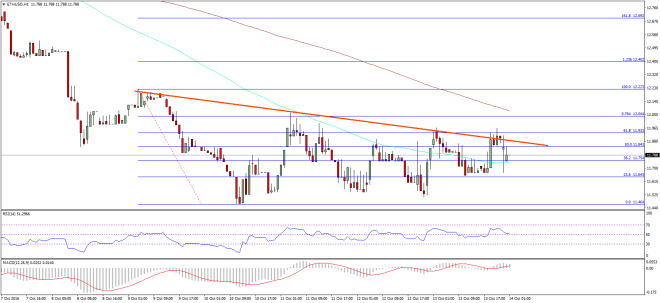

A break may clear the path for a move towards the $12.10 level at least. We need to see how long the price can stay below the trend line resistance. We must not forget that if the buyers continue to struggle, there can be a downside reaction as well.
Hourly MACD – The MACD is currently in the bullish zone, but there is no momentum.
Hourly RSI – The RSI is also above the 50 level, but heading south.
Major Support Level – $11.65
Major Resistance Level – $11.95
Charts courtesy – SimpleFX