Key Highlights
- ETH price continued to face sellers against the US dollar, as yesterday’s resistance area of $11.40 remained intact.
- Moreover, yesterday’s highlighted bearish trend line on the hourly chart (data feed via SimpleFX) of ETH/USD continued to act as a barrier for the buyers.
- As long as the price is below the trend line resistance, there can be another dip below the recent low.
Ethereum price ETH failed once again near a bearish trend line, which may continue to act as a hurdle for a recovery in ETH/USD.
Ethereum Price Barrier
Ethereum price ETH managed to climb a few points yesterday against the US Dollar, but failed to break an important resistance area above $11.00. There were two things, which acted as a barrier and stopped gains in ETH. First, the 50% Fib retracement level of the last drop from the $12.03 high to $10.59 low. Second, yesterday’s highlighted bearish trend line on the hourly chart (data feed via SimpleFX) of ETH/USD.
Both the hurdles acted as a resistance and enabled sellers to push the price down once again. Now, the trend line has moved down further and the fib level to act as a resistance changed. It is now the 38.2% Fib retracement level of the last drop from the $12.03 high to $10.59 low. Overall, a new resistance to eye is at $11.10-20.
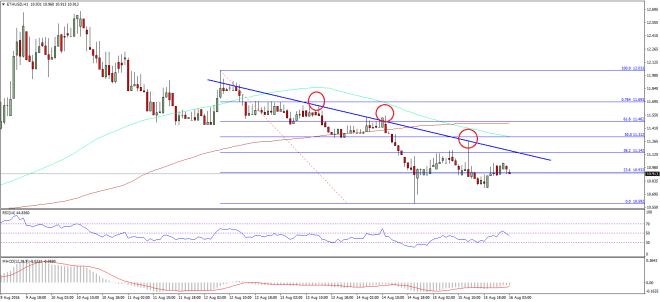

Not to forget, the price is also below the 100 hourly simple moving average, which is another resistance on the upside. On the downside, an immediate support can be around $10.80, followed by $10.60. In my view, there can be another dip before the price can gain traction.
Hourly MACD – The MACD is currently in the bearish zone, but slowly showing signs of a recovery.
Hourly RSI – The RSI just moved away from the 50 level, signaling continuing weakness.
Major Support Level – $10.80
Major Resistance Level – $11.20
Charts courtesy – SimpleFX