

Key Highlights
- Ethereum price after trading as low as $11.79 vs the US Dollar found buyers, and started to recover.
- However, yesterday’s highlighted bearish trend line on the hourly chart (data feed via Kraken) of ETH/USD is acting as a resistance.
- As long as the price is under the trend line, it remains at a risk of more declines in the near term.
Ethereum price is facing a hurdle in the form of a bearish trend line, and if it holds ETH/USD may trade down once again.
Ethereum Price Resistance
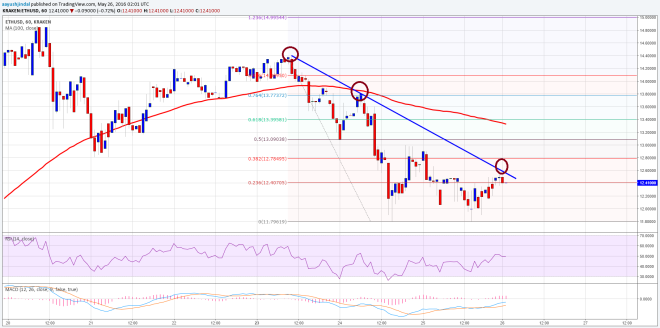
Ethereum price ETH just managed to gain bids near the $11.80 support area vs the US Dollar where the bulls appeared to defend the downside. The price is currently recovering, but facing resistance near yesterday’s highlighted bearish trend line on the hourly chart (data feed via Kraken) of ETH/USD. The highlighted trend line and resistance area hold a lot of importance, as it will define the next move in the short term.
The price is currently positioned around the 23.6% Fib retracement level of the last drop from the $14.40 high to $11.79 low. If there is a break of the trend line resistance, then a move towards the next resistance, which is the 50% Fib retracement level of the same wave is possible.

However, I will prefer to be on the sidelines, as I feel there can be another rejection in ETH/USD and the price may move down once again towards $11.80. You can plan to enter a sell trade as long as the price is below the trend line with a stop above it. However, my advice will be to trade with caution.
Hourly MACD – The MACD is in the bullish zone, which is a divergence sign for ETH.
Hourly RSI – The RSI is just above the 50 level, signaling that there is a chance of an upside move.
Intraday Support Level – $12.00
Intraday Resistance Level – $12.60
Charts courtesy of Kraken via Trading View
Header Image via NewsBTC