Key Highlights
- Ethereum price continued to face sellers against the US Dollar, and moved down intraday.
- Yesterday’s highlighted bearish trend line on the hourly chart (data feed via Kraken) of ETH/USD continued to act as a resistance area.
- The price is now below the 100 hourly simple moving average, which might ignite more downsides.
Ethereum price is struggling to gain momentum, and if the trend line resistance holds, more losses are likely in the short term.
Ethereum Price Resistance
Ethereum price ETH attempted to trade higher on a couple of occasions versus the US Dollar yesterday, but it failed to gain the momentum. The main hurdle for the upside move was yesterday’s highlighted bearish trend line on the hourly chart (data feed via Kraken) of ETH/USD. The trend line resistance acted as a barrier and prevented gains.
Moreover, the 23.6% Fib retracement level of the last leg from the $15.10 high to $13.70 low is also playing its part well in stopping the upside move along with the trend line. The last but not the least, the 100 hourly simple moving average is also positioned just around the trend line resistance. Overall, there is a major resistance formation at $14.00.
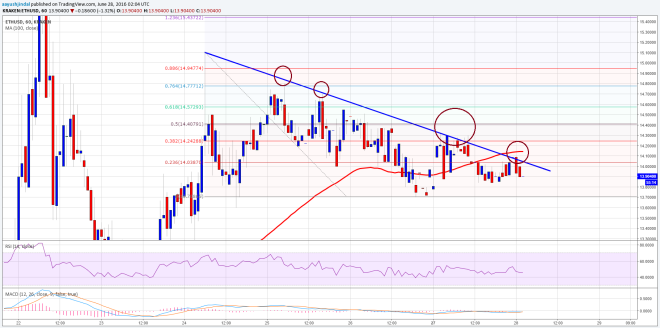

As long as the price is below it, there are chances of it moving down from the current levels. I think a test of the $13.50 support area is possible in the short term where the ETH bulls may appear. On the other hand, a close above the 100 hourly SMA might ignite more gains in ETH, which could take it towards the 50% Fib retracement level of the last leg from the $15.10 high to $13.70 low.
Hourly MACD – The MACD is not moving a lot, means the price may not change much in the short term.
Hourly RSI – The RSI is below the 50 level, which is a negative sign for the bulls.
Major Support Level – $13.70
Major Resistance Level – $14.00
Charts courtesy of Kraken via Trading View