Key Highlights
- Ethereum price after a minor correction against the US Dollar found buyers on the downside.
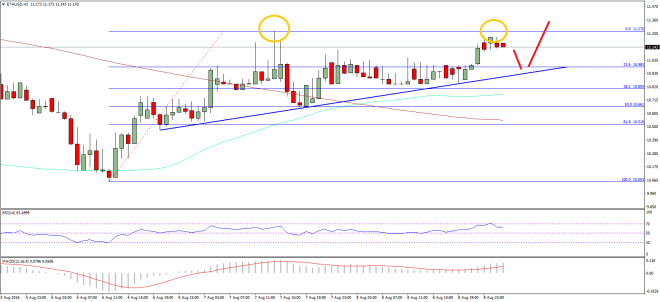
- Yesterday’s short-term bullish trend line highlighted on the hourly chart (data feed via SimpleFX) of ETH/USD acted as a perfect support area.
- On the upside, the pair is still struggling to break the $11.20-30 resistance, which may ignite another correction.
Ethereum price is slowly and steadily grinding higher against the US Dollar, but it lacks momentum to clear a couple of important resistance levels.
Ethereum Price Support
Ethereum price ETH yesterday moved a few points lower against the US Dollar and found support. Yesterday’s highlighted short-term bullish trend line on the hourly chart (data feed via SimpleFX) of ETH/USD provided support and stopped the downside move as forecasted. The trend line support helped the bulls to gain bids, and as a result, there was an upside reaction.
The price traded near the last swing high of $11.20-30 where it found sellers once again. The last two hourly candles are bearish and suggesting a downside move. If there is no increase in the momentum, there is a chance of a downside move towards the same trend line and support area. An initial support might be around the 23.6% Fib retracement level of the last wave from the $10.05 low to $11.26 high.

I think the price is forming a constructive structure for the next move and just waiting for a catalyst. Now, depending on the catalyst there can be the next wave. In my view, the highlighted trend line holds key in the short term and must hold if the price has to trade higher moving ahead.
Hourly MACD – The MACD is back in the bullish zone, which is a good sign.
Hourly RSI – The RSI is well above the 50 level, calling for more gains in ETH versus the USD.
Major Support Level – $10.95
Major Resistance Level – $11.27
Charts courtesy – SimpleFX