

Key Highlights
- Ethereum price broke a resistance area this past week vs the US Dollar and traded higher.
- There was a contracting triangle pattern formed on the 4-hours chart (data feed via Kraken) of ETH/USD, which was broke to clear the way for more gains.
- The price may correct a few points higher, and might find buyers near the $9.50 support area.
Ethereum price traded with a bullish bias this past week, and it looks like ETH may continue to trade higher in the near term.
Ethereum Price – Buy Near 100 SMA
Ethereum price ETH was in an uptrend this past week vs the US Dollar, and it broke $10.0 to trade towards $11.00 where it found sellers. The price traded as high as $11.10 before starting to correct lower. Before starting an uptrend ETH/USD broke a contracting triangle pattern formed on the 4-hours chart (data feed via Kraken). The price also settled above the 100 simple moving average, which may now act as a support area.
ETH is currently correcting lower, and testing the 23.6% Fib retracement level of the last wave from the $7.10 low to $11.10 high. However, the most important support lies on the downside. The broken triangle trend line may now provide support to the ETH bulls, as it is also positioned with the 38.2% Fib retracement level of the last wave from the $7.10 low to $11.10 high.
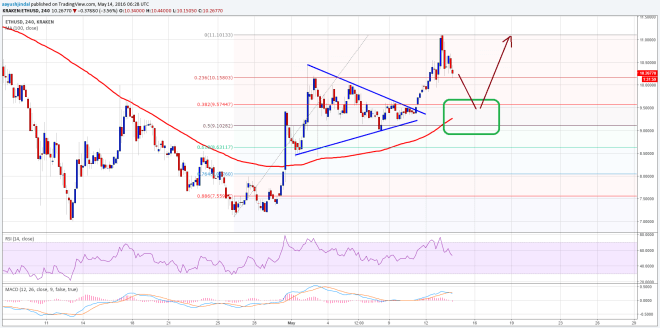

However, one crucial support is at the 100 SMA (H4 chart), which can act as a barrier for sellers. One may consider buying dips ETH/USD, but only as long as the price is above the 100 SMA (which can be a stop).
4H MACD – The 4-hours MACD is about to move in the bearish slope, which is a sign of a downside move.
Hourly RSI – The RSI is above the 50 level, meaning the price may move higher once again after a correction.
Intraday Support Level – $9.50
Intraday Resistance Level – $11.00
Charts courtesy of Kraken via Trading View
Image: NewsBTC