
Reason to trust
How Our News is Made
Strict editorial policy that focuses on accuracy, relevance, and impartiality
Ad discliamer
Morbi pretium leo et nisl aliquam mollis. Quisque arcu lorem, ultricies quis pellentesque nec, ullamcorper eu odio.
- ETH price declined recently, but it found a strong support above $132 against the US Dollar.
- The price recovered and it is now facing a solid resistance near the $137-138 zone.
- There is a major breakout pattern formed with resistance at $138 on the 4-hours chart of ETH/USD (data feed via Kraken).
- The pair is likely to accelerate higher once there is a proper break above $138 and $140.
Ethereum price is aligning for the next move versus the US Dollar and Bitcoin. ETH/USD will most likely climb higher as long as there is no close below the $132-133 support area.
Ethereum Price Analysis
After forming a stop near the $144 level, there was a steady decline in ETH price against the US Dollar. The ETH/USD pair declined below the $140 support level to move into a bearish zone. Later, it found support near the $135 level, but buyers failed to hold losses. Finally, there was a downside break below the $135 support and the 100 simple moving average (4-hours). The price declined below the $134 support and traded close to the $132 support area.
Recently, the price recovered and moved above the $135 level. However, the price seems to be facing a strong resistance near the $137-138 area. At the moment, it is trading near the $135 level and the 100 simple moving average (4-hours). An immediate support is near the 50% Fib retracement level of the last wave from the $132 low to $138 high. More importantly, there is a major breakout pattern formed with resistance at $138 on the 4-hours chart of ETH/USD.
The triangle support is near the $134 level, below which the next key support is near the $132 level. It seems like the price is preparing for the next move either above $138 or below $134. On the downside, there are many supports near the $134, $133 and $132 levels. Therefore, there are high chances of an upside break above the $137-138 resistance area.
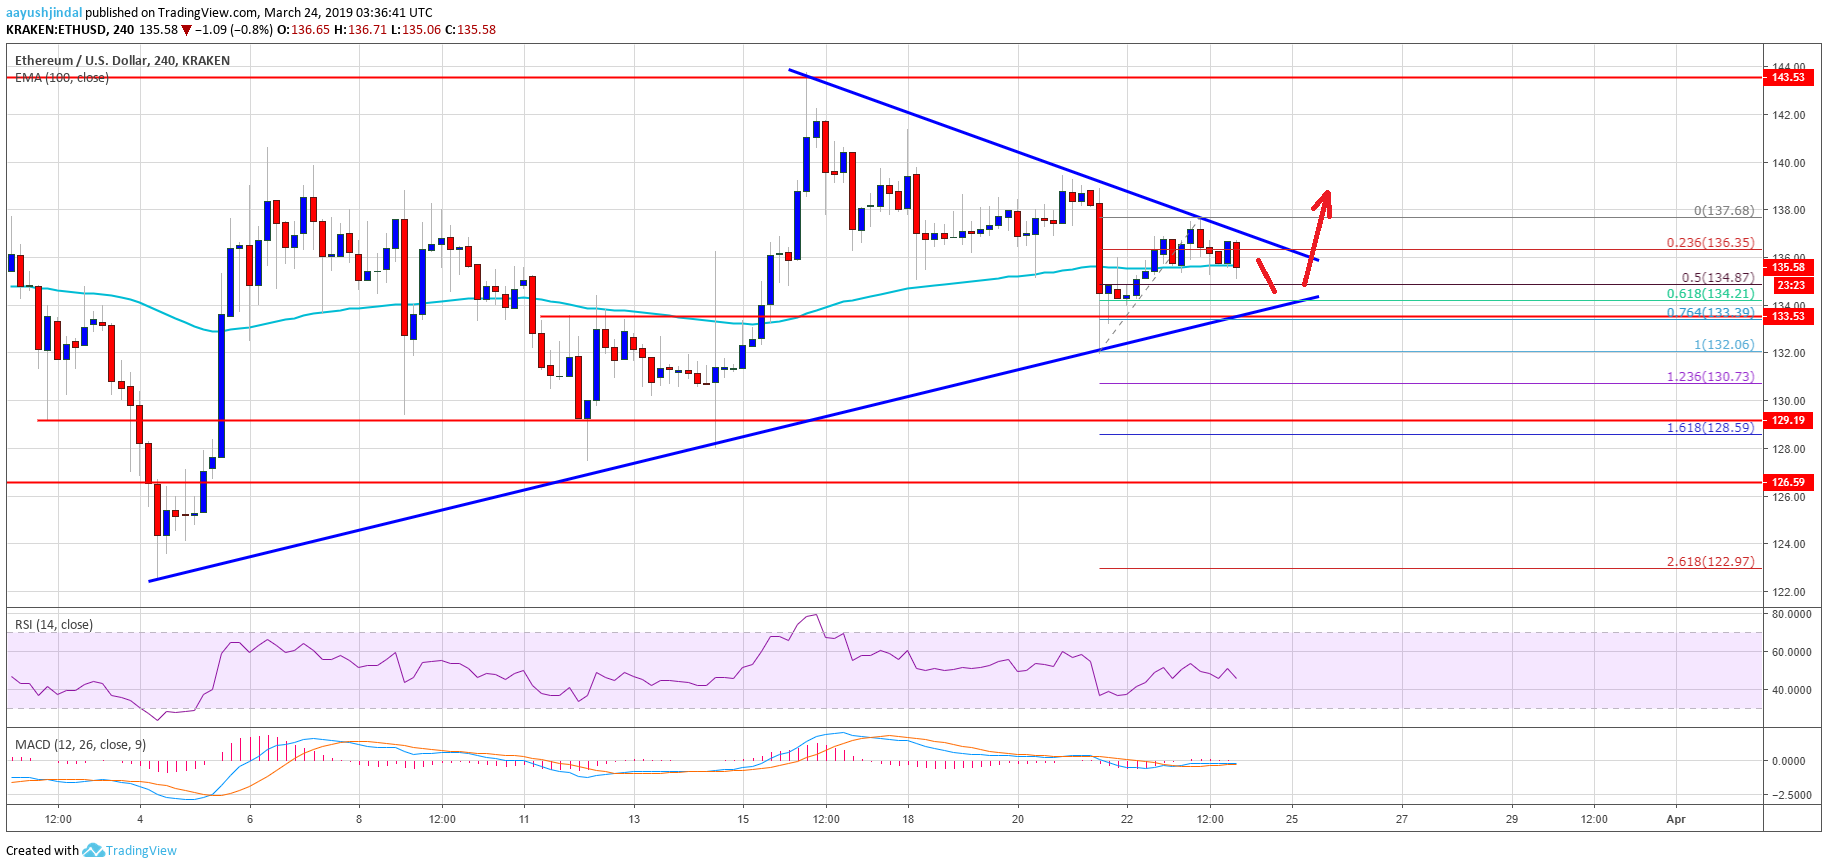
The above chart indicates that ETH price is likely to climb above the $137-138 resistance area. In the mentioned bullish scenario, the price could even break the $140 resistance and revisit the $144 resistance area. The next key resistance is near the $148 level, followed by $150. On the flip side, if buyers fail to push the price above $138, there could be a downside reaction. A break below the $132 support may call for a test of the $130 support.
Technical Indicators
4 hours MACD – The MACD for ETH/USD is currently flat, with a few positive signs.
4 hours RSI – The RSI for ETH/USD is currently below the 50 level, with a bearish angle.
Major Support Level – $134
Major Resistance Level – $138


