Key Highlights
- ETH price made a downside move and declined below the $500 level before a slight recovery against the US Dollar.
- There is a monster bearish trend line forming with resistance at $535 on the 4-hours chart of ETH/USD (data feed via Kraken).
- The pair remains at a risk of more losses if it fails to move above the trend line and $535.
Ethereum price is showing a lot of bearish signs against the US Dollar and Bitcoin. ETH/USD must recover soon else it could extend declines in the near term.
Ethereum Price Resistance
There was a sharp downside move this past week as ETH price tumbled below the $600 support against the US Dollar. The price even declined below the $500 handle and traded towards the $450 level. It traded as low as $436 before it started an upside move. It recovered and traded above the 23.6% Fib retracement level of the last decline from the $749 high to $436 low.
However, the upside move was protected by the $600 resistance. Moreover, the 50% Fib retracement level of the last decline from the $749 high to $436 low acted as a strong resistance. Lastly, a monster bearish trend line with resistance at $535 on the 4-hours chart of ETH/USD also prevented an upside move. The pair is currently following the same trend line and current resistance at $535. Buyers must gain traction and move the price above the $535 resistance else there is a risk of more losses.
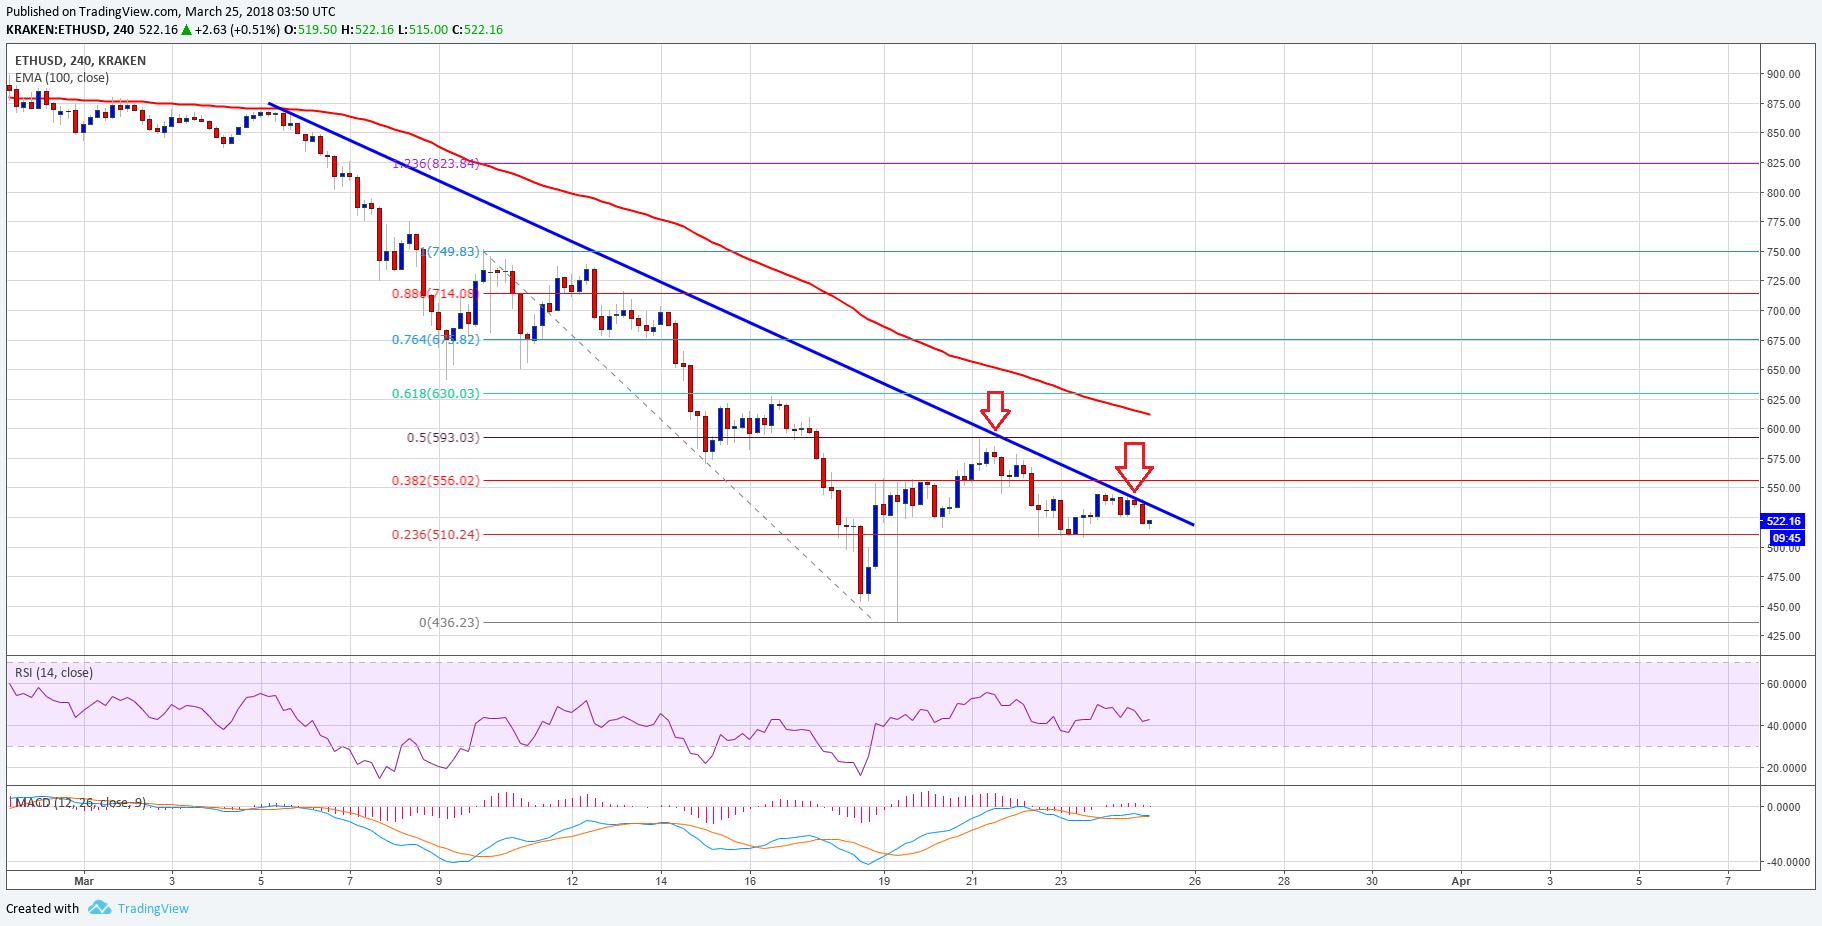

On the downside, the $510 support may act as a short term support. A break below the $510 support could open the doors for more losses. On the flip side, above the mentioned $535, the price may recover above the $580 level in the near term.
4-hours MACD – The MACD is slowly moving back in the bearish zone.
4-hours RSI – The RSI is currently well below the 50 level.
Major Support Level – $510
Major Resistance Level – $535
Charts courtesy – Trading View