

Key Highlights
- Ethereum price surged higher this past week vs the US Dollar and traded as high as $14.88 where it found sellers.
- I was expecting the price to test the $15.00 level, but it looks like there was a minor miss.
- There was a bullish trend line formed on the hourly chart (data feed via Kraken) of ETH/USD, which was broken during the downside move.
Ethereum price blasted higher this past week vs the USD, but it looks like a short term top is formed in ETH/USD around $14.88 level.
Ethereum Price – Down Move Likely?
Ethereum price ETH was in an uptrend during the most part of this past week vs the US Dollar, as it continued to trade higher. There was a bullish trend line formed on the hourly chart (data feed via Kraken) of ETH/USD, which continued to act as a support area and pushed the price higher. However, after trading as high as $14.88, there were offers presented and the price moved down.
The highlighted bullish trend line and support area was broken to open the doors for more losses in the near term. The price also closed below the 23.6% Fib retracement level of the last move from the $10.00 low to $14.88 high. However, ETH is currently finding bids near the 100 hourly simple moving average, which is acting as a hurdle for sellers.
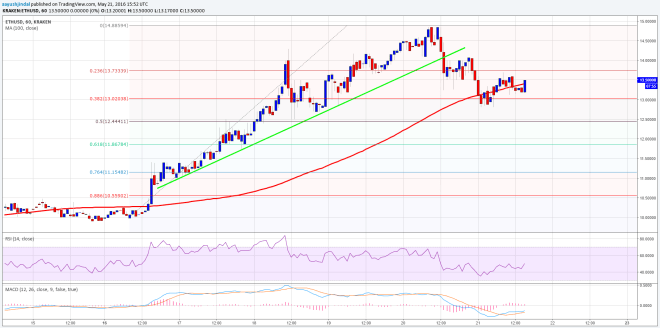

We need to see how long the price stays around the 100 hourly SMA. A close below it may open the doors for more losses in the near term, and might call for a change in the trend from bullish to bearish.
Hourly MACD – The hourly MACD is about to move in the bearish slope, which may ignite a downside move.
Hourly RSI – The RSI is below the 50 level, calling for a correction in the short term.
Intraday Support Level – $12.40
Intraday Resistance Level – $14.00
Charts courtesy of Kraken via Trading View
Image Courtesy of NewsBTC