Key Highlights
- Ethereum price suffered heavy losses this past week against the US Dollar, and almost every major rally was sold.
- There is a contracting triangle pattern formed on the 4-hours chart (data feed via Kraken) of ETH/USD, which may provide us the next break.
- The price is below the 100 simple moving average (H4), which is a bearish sign and a concern for the bulls.
Ethereum price remained under a bearish pressure this past week, and it looks like ETH may continue to face offers in the near term.
Ethereum Price Break
Ethereum price ETH faced a lot of sellers this past week against the US Dollar, as a crucial resistance area at $14.00 acted as a hurdle and ignited a downside move. The price traded towards the $11.00 level where it found support and started consolidating losses. There is currently a contracting triangle pattern formed on the 4-hours chart (data feed via Kraken) of ETH/USD, which holds the key for the next move.
On the upside, an initial resistance is around the 23.6% Fib retracement level of the last drop from the $16.10 high to $11.32 low. However, the most important one is around the triangle resistance area, which may act as a major barrier for the bulls. A break above it could take the price towards the 100 simple moving average (H4 chart).
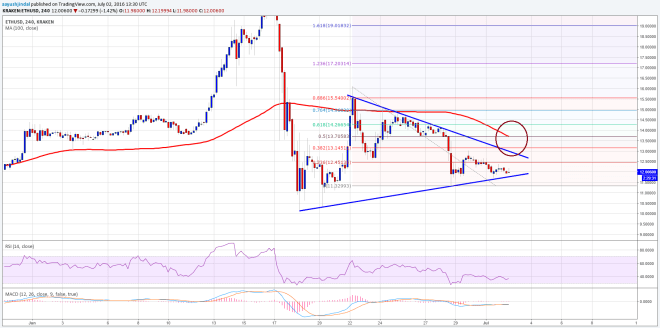

On the downside, if the ETH bears manage to break the triangle support area, then a move towards the $10.00 level is possible. I think, we need to wait for the price to complete consolidation, and then breaks either higher or lower to catch the next move.
4-hours MACD – The MACD is in the bearish slope, which is negative sign for the bulls.
4-hours RSI – The RSI is below the mid-range, calling for a bearish bias in the short term.
Major Support Level – $11.00
Major Resistance Level – $13.00
Charts courtesy of Kraken via Trading View