

- ETH price recovered a few points, but it is facing a lot of hurdles near $114 against the US Dollar.
- There was a break above a major bearish trend line with resistance at $107 on the 4-hours chart of ETH/USD (data feed via Kraken).
- The pair is likely to accelerate higher if it succeeds in surpassing the $114 and $115 resistance levels.
Ethereum price is showing a few positive signs versus the US Dollar and Bitcoin. ETH/USD must break the $114 resistance to stay in the positive zone in the near term.
Ethereum Price Analysis
Recently, we saw a couple of swing moves in ETH price above the $102 and $104 levels against the US Dollar. Later, the ETH/USD pair formed a decent support above $104 and started an upward move. The pair gained momentum above the $104 and $107 resistance levels. Moreover, there was a break above the 23.6% Fib retracement level of the last decline from the $117 high to $101 swing low. The price traded with a positive bias above the $105 pivot zone.
Moreover, there was a break above a major bearish trend line with resistance at $107 on the 4-hours chart of ETH/USD. The pair tested the $109-110 resistance area where sellers emerged. Moreover, the price also failed near the 50% Fib retracement level of the last decline from the $117 high to $101 swing low. At the moment, the price action is positive above $107, but ETH is facing a lot of hurdles near the $109 and $112 resistance levels. More importantly, the 100 hourly simple moving average is also near the $112 level to act as a solid hurdle. Finally, the 61.8% Fib retracement level of the last decline from the $117 high to $101 swing low is at $112. Therefore, the price must break the $112-114 resistance area for an upside acceleration.
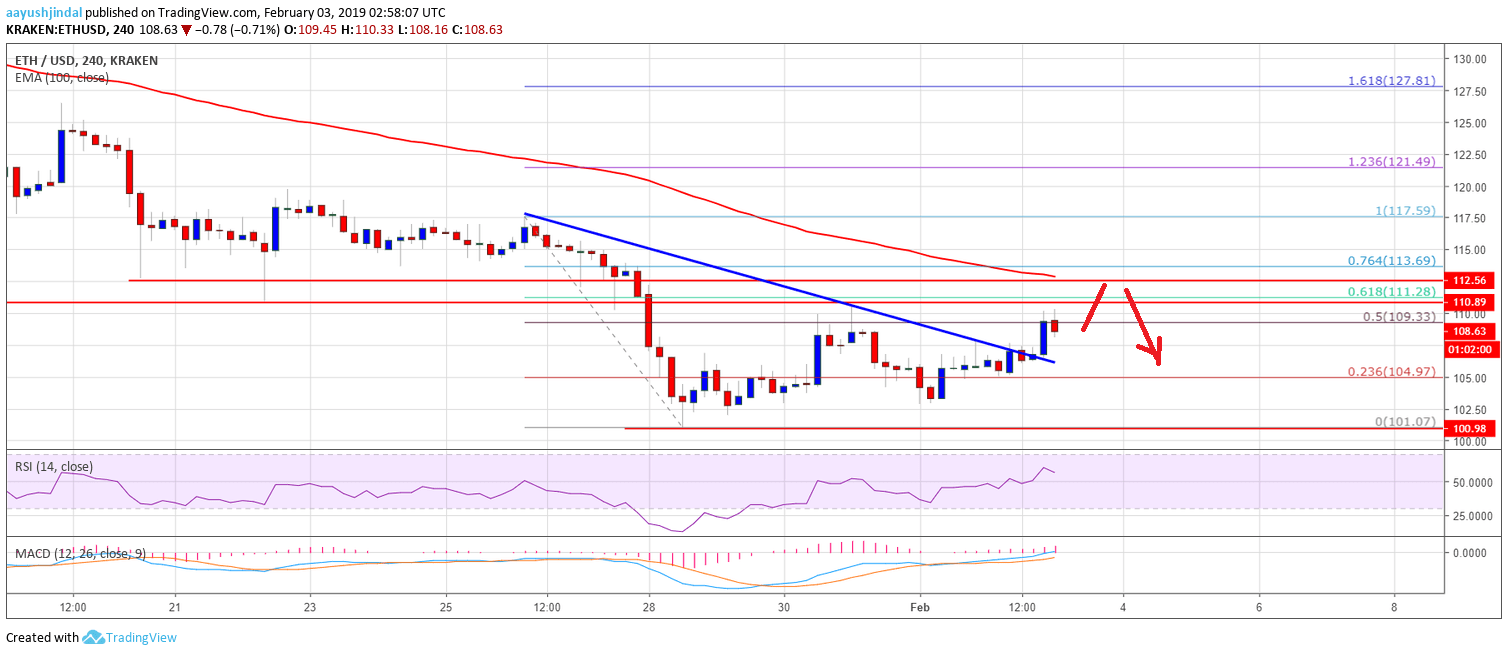

The above chart indicates that ETH price made a nice upward move above the $107 resistance. However, a proper close above $114 is needed for more gains in the near term.
Technical Indicators
4-hours MACD – The MACD for ETH/USD is slowly gaining pace in the bullish zone.
4-hours RSI – The RSI for ETH/USD is currently placed nicely above the 50 level.
Major Support Level – $107
Major Resistance Level – $114