Key Highlights
- Ethereum price rocketed higher this past week versus the US Dollar, but found resistance near $12.50.
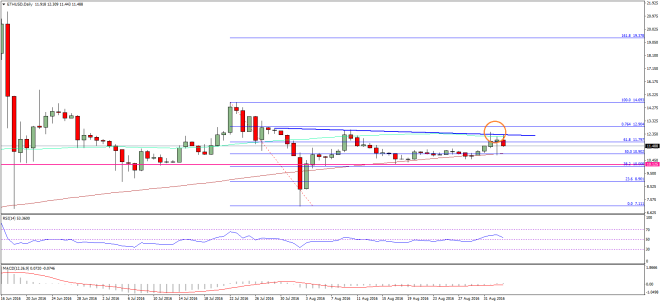
- There is a major bearish trend line formed on the daily chart of the ETH/USD pair (data feed via SimpleFX), which acted as a barrier for more gains.
- The price may correct a few more points in the near term, but remain in an uptrend.
Ethereum price after setting a short-term top versus the US Dollar at $12.50 started correcting lower and may extend the current wave.
Ethereum Price Correction
Ethereum price ETH this past week enjoyed a decent upside ride versus the US Dollar and traded as high as $12.60. There were sellers waiting on the upside to prevent further gains and they did manage to stop buyers. There is a monster bearish trend line formed on the daily chart of the ETH/USD pair (data feed via SimpleFX). It can be seen as a barrier for the ETH bulls, which currently ignited a downside move.
The most important point is the fact that the 100-day simple moving average was also around the same trend line. So, it gave more reasons for the ETH sellers to have an upper hand. The price at the moment is correcting lower, and may trade towards the 38.2% Fib retracement level of the last leg from the $8.50 low to $12.60 high. There are several support levels on the downside waiting for the ETH/USD pair, including $11.20 and $10.80.

There is a chance that the current correction wave may extend. However, the price remains in a major range and might find buyers on the downside.
Daily MACD – The MACD is just around the bullish zone, but may move back into the bearish zone.
Daily RSI – The RSI has moved above the 50 level, which is a positive sign for the ETH bulls.
Major Support Level – $11.20
Major Resistance Level – $12.00
Charts courtesy – SimpleFX