Key Highlights
- Ethereum price remained in the bullish zone against the US Dollar, and traded with a positive sentiment.
- There is a bearish trend line formed on the 4-hours chart of the ETH/USD pair (data feed via SimpleFX), which is currently acting as a resistance.
- The price is also below the 100 simple moving average on the 4-hours chart, which may also act as a resistance on the upside.
Ethereum price is currently trading higher against the US Dollar, but it is facing a couple of important hurdles on the upside.
Ethereum Price Barrier
Ethereum price ETH recent recovery was impressive as after dipping towards $7.00 against the US dollar it moved back higher. The ETH/USD pair traded as high as $11.38 where it found sellers near a bearish trend line formed on the 4-hours chart (data feed via SimpleFX). The pair corrected a few points lower to test the 23.6% Fib retracement level of the last wave from the $7.09 low to $11.38 high.
It is currently moving back higher, but the main point is that the price still remains below the highlighted trend line and resistance area, which may continue to act as a barrier. Even if the price breaks the trend line, the 100 simple moving average on the 4-hours chart is positioned on the upside to act as a second major hurdle. So, the ETH bulls near to clear two important resistance levels if they have to stay in the game.
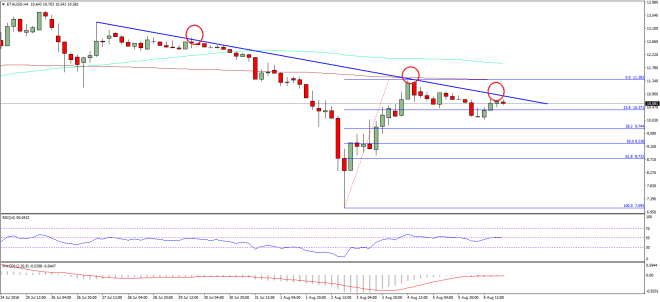

If they fail to do so, then there is a chance that ETH/USD may correct a few points more towards the 38.2% Fib retracement level of the last wave from the $7.09 low to $11.38 high, which is at $9.74. I think there may be ranging moves before the next wave.
4-hours MACD – The MACD is almost neutral, and not signaling any major move.
4-hours RSI – The RSI is just around the 50 level, suggesting indecision.
Major Support Level – $10.20
Major Resistance Level – $11.00
Charts courtesy – SimpleFX