Key Highlights
- Ethereum price traded close to the $12.70 level this past week against the US Dollar, but found sellers.
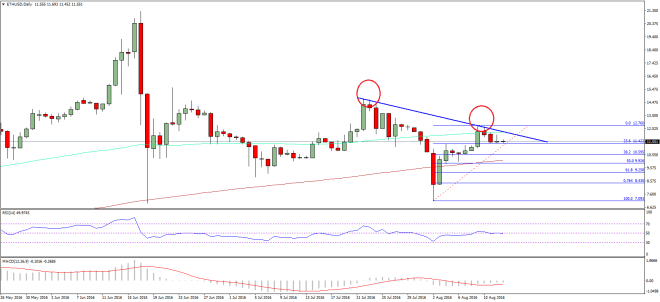
- There is a monster bearish trend line formed on the daily chart of the ETH/USD pair (data feed via SimpleFX), which acted as a barrier for an upside move.
- The price is also below the 100-day simple moving average, which is not a good sign for the ETH bulls.
Ethereum price is struggling to break a major hurdle on the daily chart versus the US Dollar, which poses a threat of a short-term downside move.
Ethereum Price Correction
Ethereum price ETH managed to spike towards the $12.70 level during the start of this past week against the US Dollar. There were offers presented around the stated level, and the price moved down. Another reason was a monster bearish trend line formed on the daily chart of the ETH/USD pair (data feed via SimpleFX). It acted as a perfect resistance for ETH and stopped upside move.
The last but not the least, the 100-day simple moving average was also around the same bearish trend line. So, we can say the recent failure around the $12.70 level was crucial and may ignite a short-term correction. The ETH/USD pair already tested the 23.6% Fib retracement level of the last leg from the $7.09 low to $12.76 high. So, there is a chance of a move towards the 38.2% Fib retracement level of the last leg from the $7.09 low to $12.76 high.

In my opinion, the pair may correct lower in the short term, but remains supported on the downside. The only thing the bulls need is a close above the highlighted trend line resistance on the daily chart.
Daily MACD – The MACD has moved into the bullish zone, which is a positive sign.
Daily RSI – The RSI is just around the 50 level, but may slide down in the short term.
Major Support Level – $11.00
Major Resistance Level – $12.60
Charts courtesy – SimpleFX