

Key Highlights
- ETH price is currently trading in a broad range above the $210 support against the US Dollar.
- There is an ascending channel formed with support at $222 on the 4-hours chart of ETH/USD (data feed via Kraken).
- The pair may decline in the short term towards the $214 and $210 support levels.
Ethereum price is consolidating versus the US Dollar and Bitcoin. ETH/USD is at a risk of a minor downside correction towards the $214 support level.
Ethereum Price Analysis
This past week, there were mostly range moves above the $210 support in ETH price against the US Dollar. The ETH/USD pair traded higher above the $220 and $224 levels, but it failed to hold gains. During the upside move, there was a break above the $227 level and the 100 simple moving average (4-hours). Moreover, the price traded above the 50% Fib retracement level of the last drop from the $240 high to $213 low.
However, the upside move was protected by the $229-230 zone. Additionally, the 61.8% Fib retracement level of the last drop from the $240 high to $213 low also acted as a resistance. The price is slowly declining and it is currently trading below the $227 level and the 100 SMA. There is also an ascending channel formed with support at $222 on the 4-hours chart of ETH/USD. If there is a downside break below the channel support, the price could decline towards the $220 and $214 support levels.
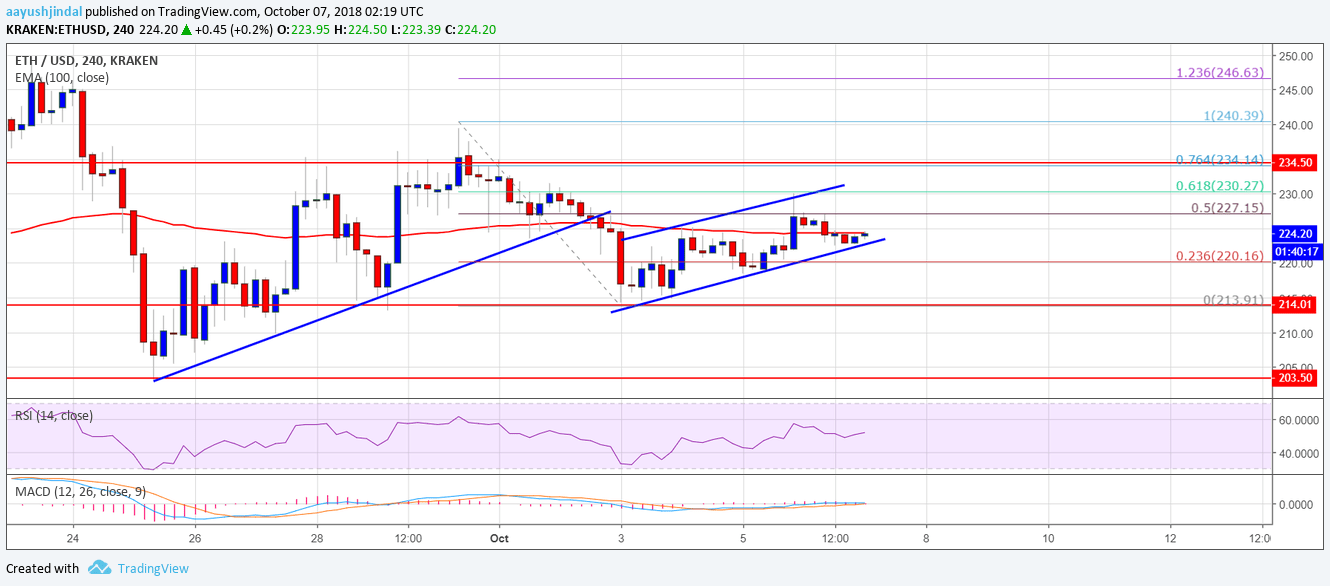

The above chart indicates that ETH price is clearly struggling to gain momentum above $229-230. If it continues to fail, there could be a bearish reaction below $214 in the near term. Until then, the price is likely to trade in a range above the $214 support level in the coming sessions.
4-hours MACD – The MACD is slightly placed in the bullish zone.
4-hours RSI – The RSI is currently near the 50 level.
Major Support Level – $220
Major Resistance Level – $230