Key Highlights
- Ethereum price after a solid decline towards the $11.48 level against the US Dollar found support.
- There is a critical contracting triangle pattern formed on the 4-hours chart of ETH/USD (data feed via SimpleFX), which may provide us the next move.
- There is a chance of the price heading higher towards the 100 simple moving average on the same chart.
Ethereum price after the recent losses started finding bids, and it looks like there is a support forming on the downside for a minor correction.
Ethereum Price Correction
Ethereum price ETH fell sharply this past week against the US Dollar and surprised many traders. It traded as low as $11.48 where the bulls appeared and prevented further losses. The price is currently forming a critical contracting triangle pattern on the 4-hours chart of ETH/USD (data feed via SimpleFX). It may play a major role for the next move in the near term. The upper trend line of the triangle pattern is also coinciding with the 23.6% Fib retracement level of the last drop from the $13.34 high to $11.48 low.
So, the triangle resistance holds a lot of importance in the near term. The last couple of candles are positive, and the pair is continuously finding bids on the downside. It looks like there is a chance that the price may gain traction and trade higher. The next stop on the upside could be around the 50% Fib retracement level of the last drop from the $13.34 high to $11.48 low at $12.40.
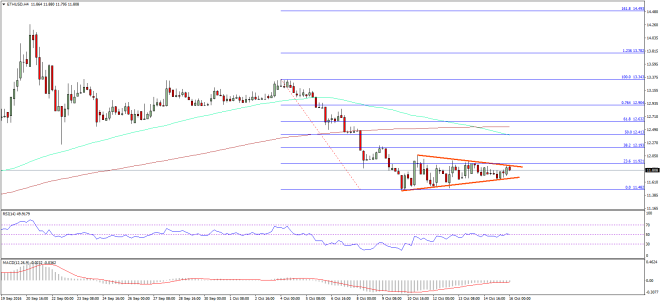

The stated level also holds a lot of value as the 100 simple moving average on the 4-hours chart is positioned near it. Overall, there is a chance of an upside move, which may be limited.
4-hours MACD – The MACD has just moved into the bullish zone, which is a good sign.
4-hours RSI – The RSI is attempting to break the 50 level to encourage the bulls.
Major Support Level – $11.50
Major Resistance Level – $11.95
Charts courtesy – SimpleFX