Key Highlights
- ETH price after a couple of downside swing move towards the $47.50 level found support against the US Dollar.
- There is a monster bullish trend line formed with support at $49.90 formed on the 4-hours chart of ETH/USD (data feed via SimpleFX).
- On the upside, the pair needs to break the $52.80-53.00 resistance area for a sustained upside move.
Ethereum price is back in the bullish zone against the US Dollar, and currently ETH/USD is attempting a major upside break above $53.00.
Ethereum Price Resistance
This past week, we saw how ETH price declined heavily and moved down towards $47.50 against the US Dollar. Later, the price found support at $47.40, and started an upside move. There was a nice reversal, as the price moved above the 50% Fib retracement level of the last decline from the $52.41 high to $47.41 low. The most important point was no close below the 100 simple moving average (H4) at $47.10.
And, the downside move was protected near a monster bullish trend line formed with support at $49.90 formed on the 4-hours chart of ETH/USD. The price is currently trading above the 76.4% Fib retracement level of the last decline from the $52.41 high to $47.41 low. It may soon test the last swing high at $52.41. A break above it won’t be easy, as there is a crucial resistance near $52.80-53.00.
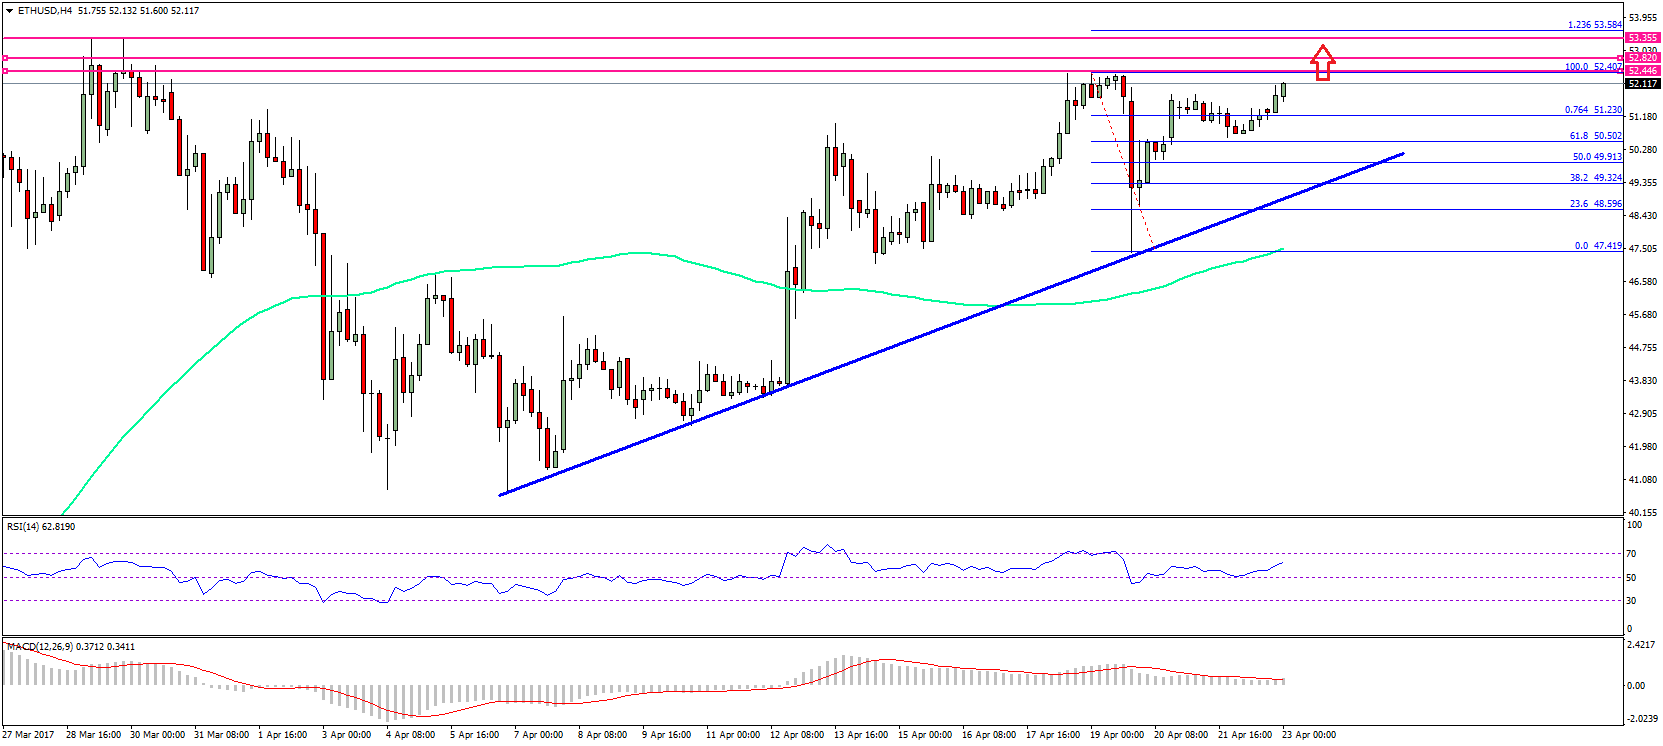
The stated resistance acted as barrier on many occasions, and prevented a move above $54.00. If there is a break, the price may test the 1.236 extension of the last decline from the $52.41 high to $47.41 low. As long as the price is above the highlighted trend line support at $49.90-75, there are chances of an upside break in the near term.
4-hours MACD – The MACD is currently well in the bullish zone.
4-hours RSI – The RSI is moving higher and well above the 50 level.
Major Support Level – $49.80
Major Resistance Level – $52.80
Charts courtesy – SimpleFX