Key Highlights
- ETH price remained in a narrow range for a few sessions above $205 against the US Dollar, and currently looking for a break.
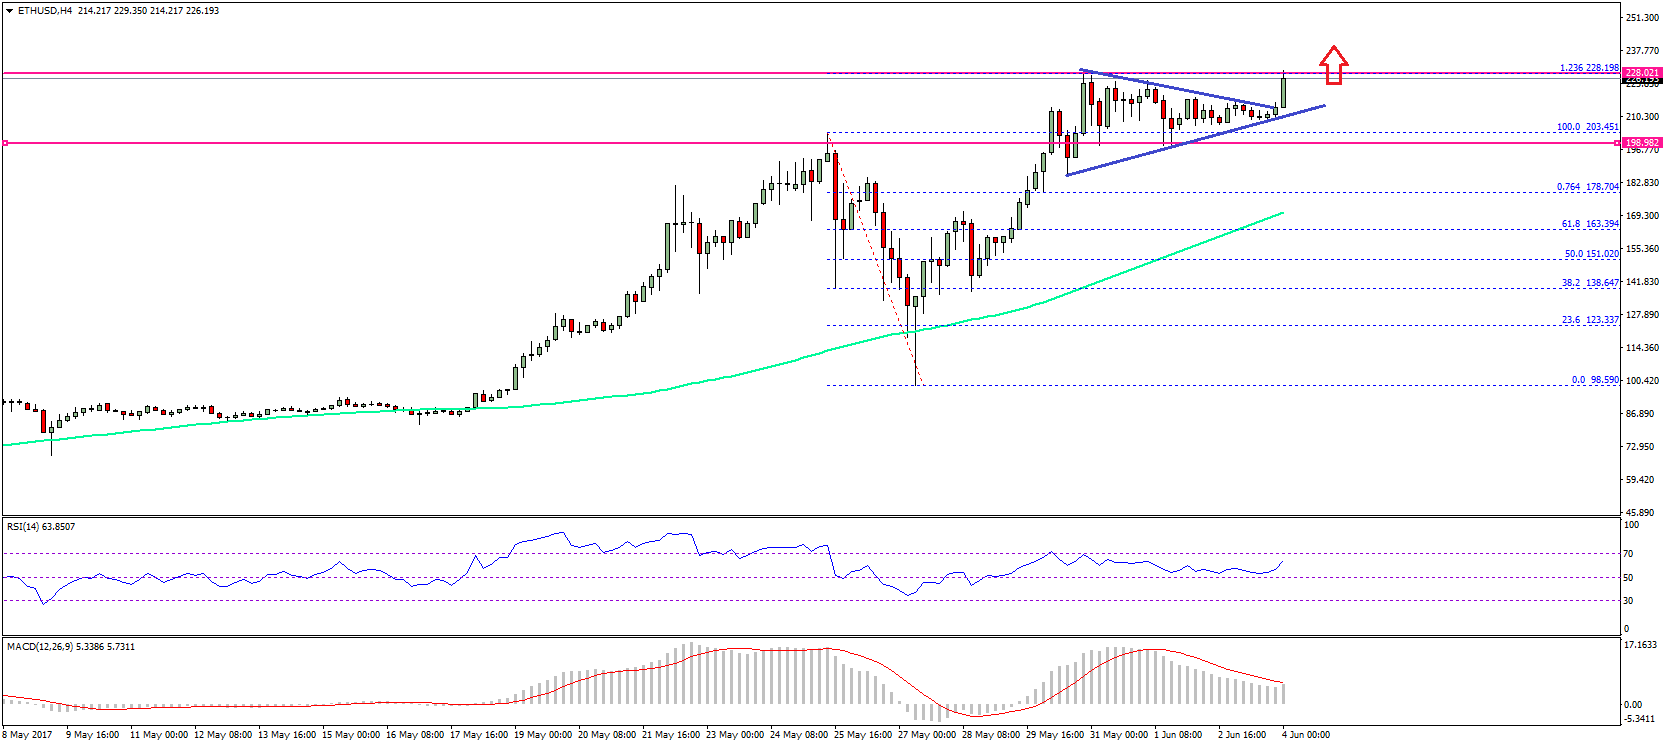
- The ETH/USD pair is about to break the range resistance at $2258 on the 4-hours chart (data feed via SimpleFX).
- Once there is a close above $230, the pair could head higher towards $245-250.
Ethereum price is breaking higher against the US Dollar and Bitcoin, and ETH/USD looks set for more gains above $228 in the near term.
Ethereum Price Nasty Gains
In the last analysis, we saw a few swing moves in ETH price above $205 against the US Dollar. The price traded in a range with a crucial resistance at $228. Recently, the price dipped towards $203 where it found strong bids and started moving higher. During the upside move, the price broke an intermediate resistance at $212, which opened the doors for more gains.
There was even a break above a bearish trend line at $210 on the 4-hours chart of ETH/USD, which is a good sign for buyers. At the moment, the price is attempting to break $228. It also represents the 1.236 extension of the last drop from the $203 high to $98 low. So, a break above it could open the doors for a test of $245-250. On the downside, there is a bullish trend line formed on the same chart with support at $212.
If the price fails to close above $228 in this leg, then any dip towards $212 can be seen as buying opportunity. In the weekly bias, there is a chance of ETH/USD breaking higher towards $250 very easily. On the downside the $205-200 levels remain a strong support and buy zone.
4-hours MACD – The MACD is still in the bullish zone.
4-hours RSI – The RSI is well above the 50 level, and heading higher towards 65.
Major Support Level – $205.00
Major Resistance Level – $228.00
Charts courtesy – SimpleFX