Key Highlights
- Ethereum price remained under a lot of pressure this past week against the US Dollar and Bitcoin.
- There is a crucial bearish trend line formed on the daily chart of ETH/USD (data feed via SimpleFX), which is pushing the price down.
- The $8.00 handle may play a major role for the pair in the near term for the ETH buyers.
Ethereum price is under a lot of bearish pressure vs the US Dollar and Bitcoin, and ETH/USD may continue to trade lower going forward.
Ethereum Price Downside Pressure
It was a bad week for ETH price, as it declined heavily against the US Dollar and Bitcoin. There was an increase in the bearish pressure, igniting downside move in ETH/USD and ETH/BTC. The ETH/USD pair even traded towards $8.46 before correcting a few points. On the upside, there is a crucial bearish trend line formed on the daily chart of ETH/USD (data feed via SimpleFX).
It acted as a monster resistance area for the pair, and may continue to push it lower. It already corrected once, but found sellers near the 23.6% Fib retracement level of the last decline from the $12.75 high to $8.46 low. The chart does not support a bullish view at the moment, and it looks like the downside pressure is intact in the short term. Above the 23.6% Fib retracement level, the highlighted trend line resistance may prevent gains, and stop the upside move.
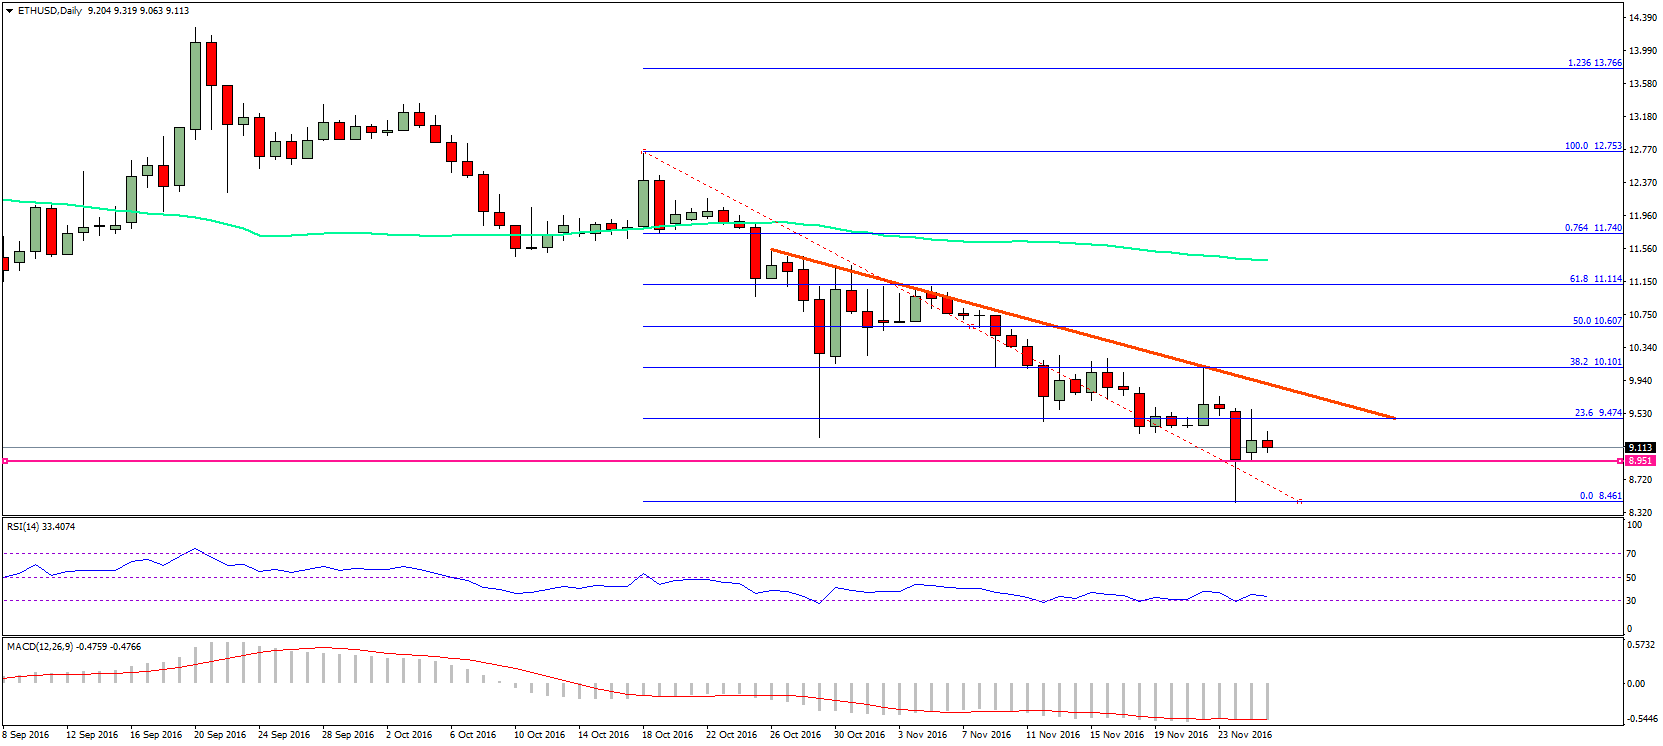
On the downside, the $8.50 level may act as a support. A break below it may push the price further down. The next important support is around the $8.20, and may prevent the downside move.
Daily MACD – The MACD is currently in the bearish zone, and not showing any signs of a recovery.
Daily RSI – The RSI is currently around the oversold area with no clear direction.
Major Support Level – $8.50
Major Resistance Level – $9.50
Charts courtesy – SimpleFX