Key Highlights
- ETH price soaring above the $100 level against the US Dollar was impressive and shows its strength.
- There is a major bullish trend line formed with support at $88 formed on the daily chart of ETH/USD (data feed via SimpleFX).
- On the upside, a daily close above $100 could trigger further gains in the near term.
Ethereum price had an impressive run this past week against the US Dollar and Bitcoin, as ETH/USD managed to test $100 and traded with bullish tone.
Ethereum Price Upside Surge
It looks like it was one of the best weeks so far for ETH price as it tested the $100 level against the US Dollar. There was a solid upside surge as the price broke the $80 and $90 levels to test the all-important $100 level. A new high was formed just above $100 at $100.60. It was a great bullish ride, as sellers were completely decimated once there was a break above the $76 swing high. There was even a break above the 1.618 extension of the last decline from the $76 high to $65 low.
The price traded as high as $100.60 and now correcting lower. A nice support is formed near $88. There is also a major bullish trend line formed with support at $88 formed on the daily chart of ETH/USD. Moreover, the 23.6% Fib retracement level of the last wave from the $40.60 low to $100.60 high is at $86.45. So, we can say there are many crucial support levels near $88 and $86.
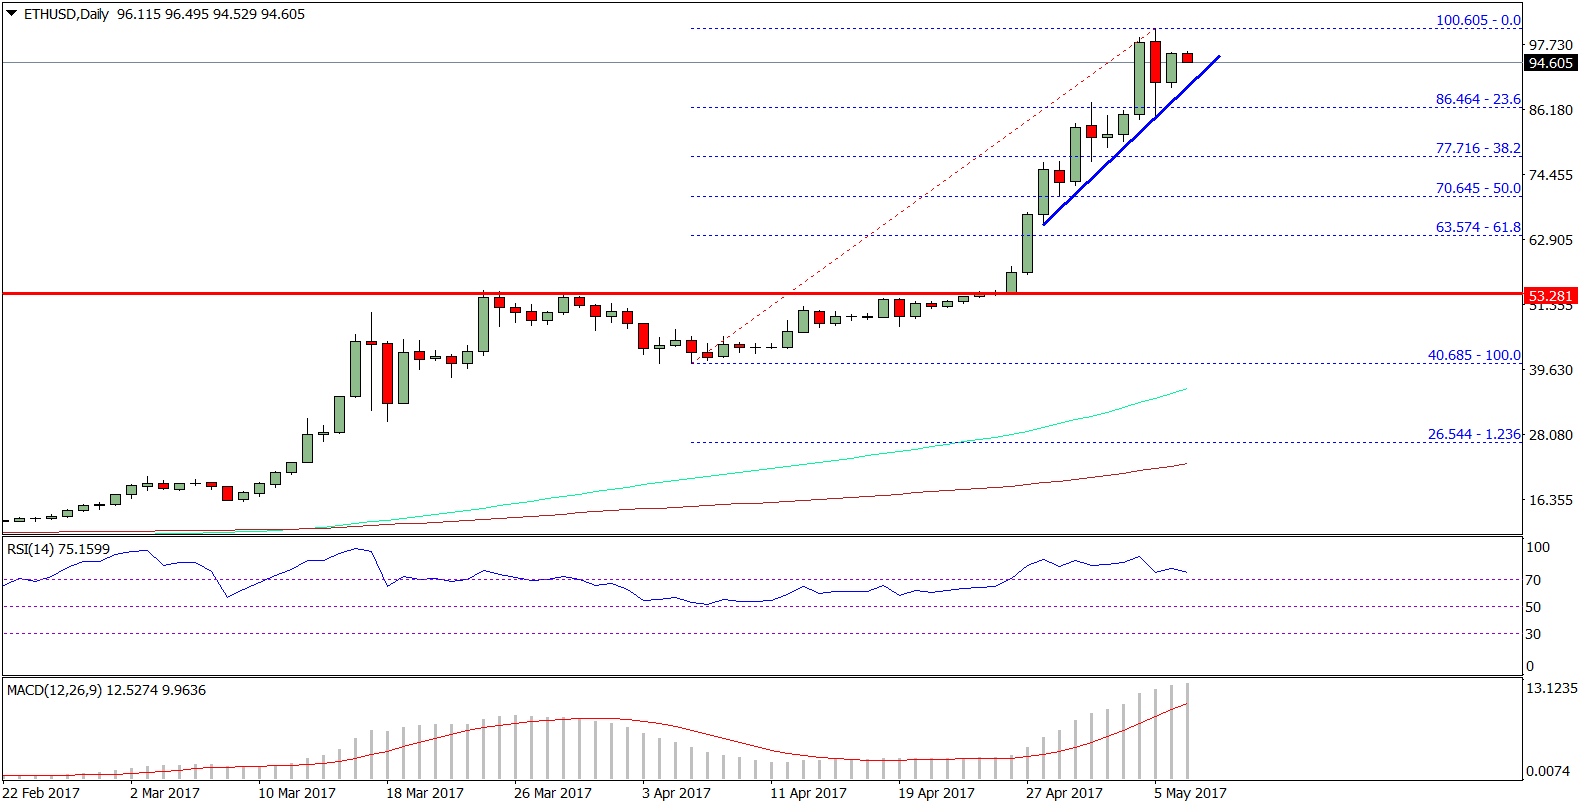
A break below the trend line support won’t be good. It may prompt a move towards the 38.2% Fib retracement level of the last wave from the $40.60 low to $100.60 high is at $77.70. On the other hand, a break above $100.5 may call for further gains.
Daily MACD – The MACD is very strong in the bullish zone.
Daily RSI – The RSI is currently into the overbought levels around 76.
Major Support Level – $88.00
Major Resistance Level – $100.00
Charts courtesy – SimpleFX