Key Highlights
- ETH price was back in action against the US Dollar and moved back above the $18.00 handle.
- It looks like the ETH/USD pair (data feed via SimpleFX) completed a correction near !6.06 and recovered.
- The pair is heading higher, and it looks like it may break the last high at $20.54.
Ethereum price made a nice bounce back against the US Dollar, and ETH/USD now looks set for further gains above $19.50.
Ethereum Price Bullish Trend
This past week was amazing for ETH price, as it moved down and corrected lower against the US Dollar and Bitcoin. Later, the correction was over and the price recovered. The ETH/USD pair traded as low as $16.06, and then started to move back higher. It looks like the correction wave was over near $16.06, and now back in the bullish zone. The price is now trading with a positive zone with moved above the $18.00 level and $19.00. These are positive signs and might push the price further higher in the near term.
There was a downside move towards the 23.6% fib retracement level of the last wave from the $5.69 low to $20.54 high. Once the price completed the correction near the stated fib level, it moved back higher. Later, the price moved higher, and moved above the 50% fib retracement level of the last decline from the $20.54 high to $16.06 low. If the current trend remains intact, there is a chance of a move above the last high of $20.54.
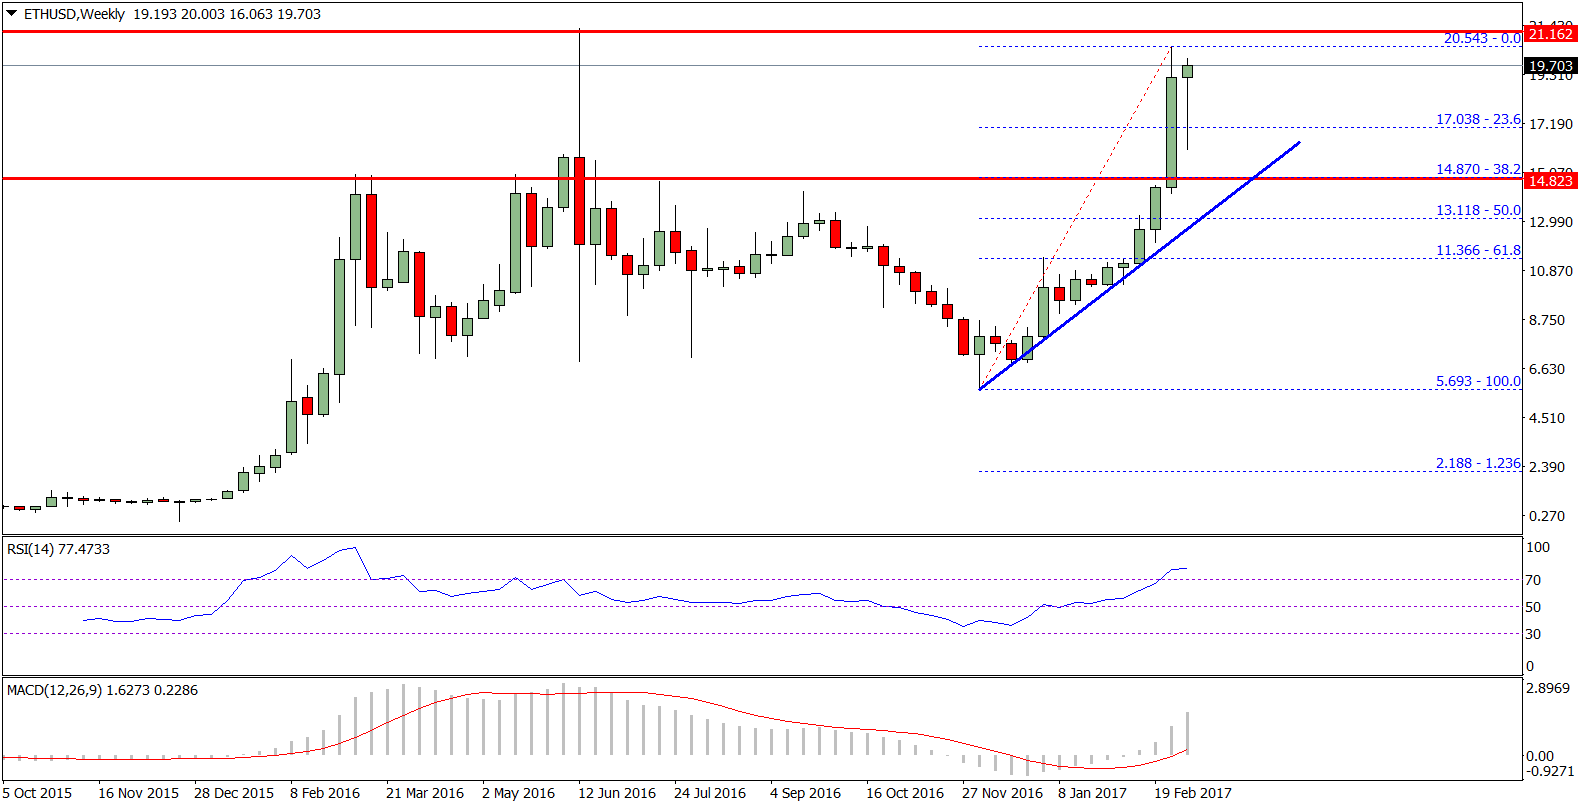
If the momentum stays, the price could trade towards the most important high near $21.50. Overall, the price is trading with a positive tone, and remains buy on dips.
Daily MACD – The MACD is now well placed in the bullish zone.
Daily RSI – The RSI is into the overbought levels, and signaling a minor pullback once again.
Major Support Level – $19.00
Major Resistance Level – $20.54
Charts courtesy – SimpleFX