

- ETH price is down more than $30 in the past few days against the US Dollar.
- The price even spiked below $150 and it is currently correcting higher.
- There is a major breakout pattern forming with resistance near $152 on the 4-hours chart of ETH/USD (data feed via Kraken).
- The pair is struggling to correct higher and it could resume its decline below $150.
Ethereum price is trading in a bearish zone below $155 and $160 against the US Dollar, similar to bitcoin. ETH price is likely to revisit $125 before it could recover.
Ethereum Price Weekly Analysis
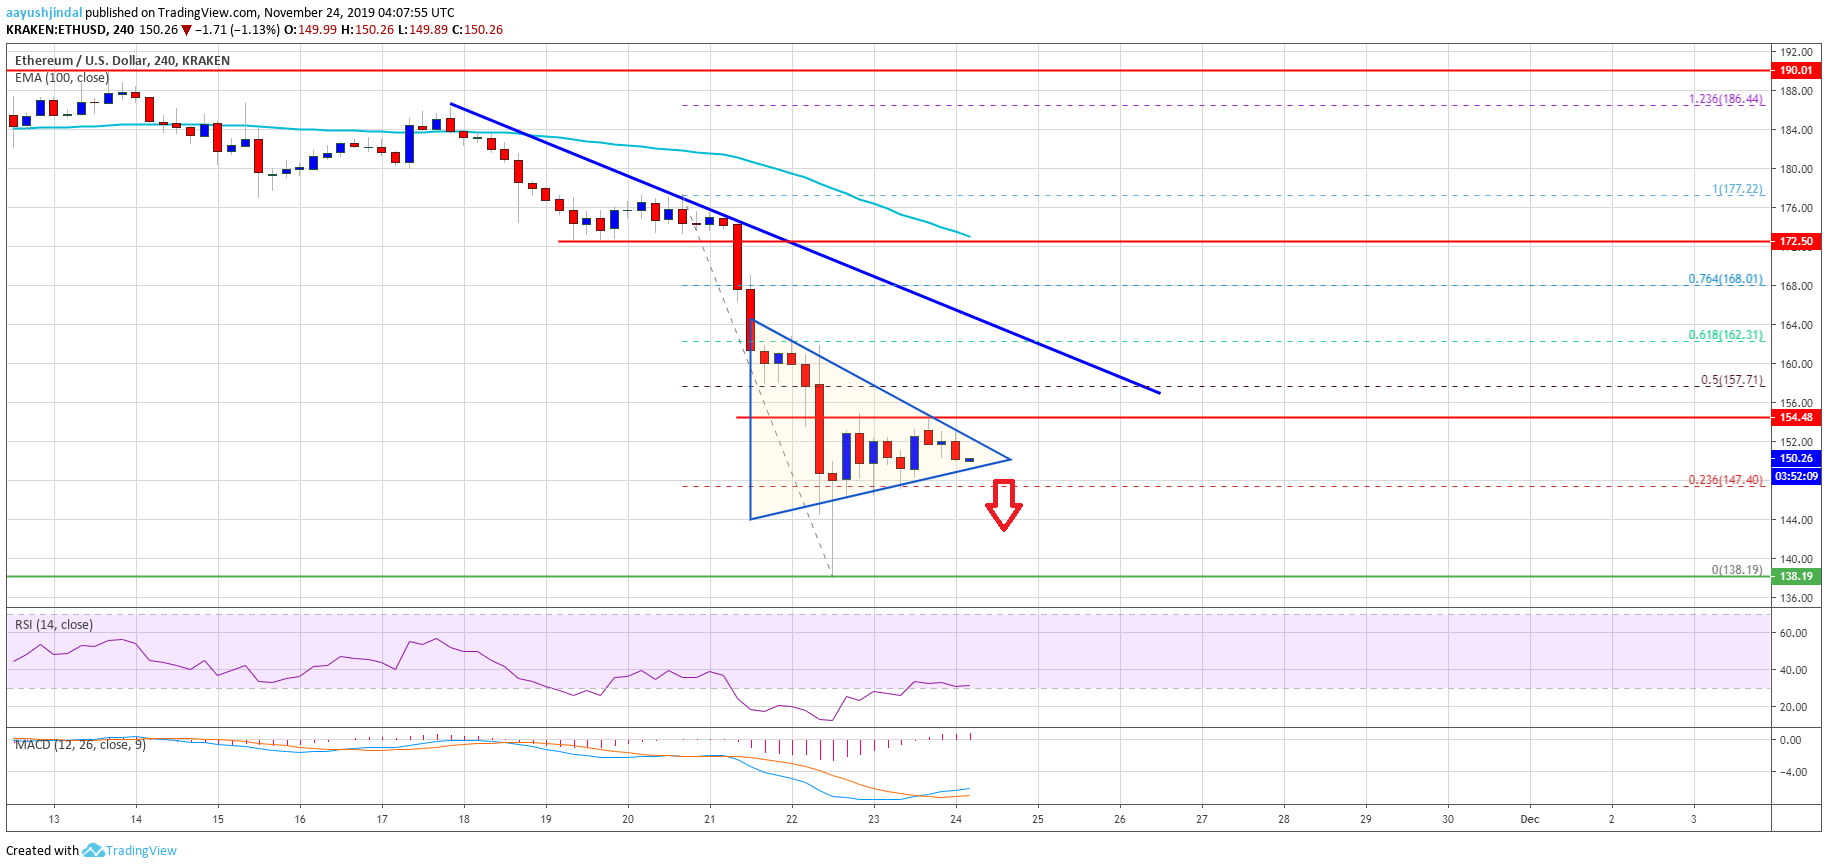
This past week, Ethereum declined heavily after it broke the key $172 support against the US Dollar. ETH price traded below many key supports near the $170 and $165 levels.
Moreover, there was a break below the $150 support and the price settled well below the 100 simple moving average (4-hours). A new multi-month low was formed near $138 and the price recently corrected higher.
It broke the $145 and $150 resistance levels. Besides, Ethereum recovered above the 23.6% Fib retracement level of the downward move from the $177 high to $138 low.
However, the price seems to be facing a strong resistance near the $155 level. More importantly, there is a major breakout pattern forming with resistance near $152 on the 4-hours chart of ETH/USD.
Therefore, an upside break above the $152 and $155 levels might push the price higher. An immediate resistance is near the $158 level. It represents the 50% Fib retracement level of the downward move from the $177 high to $138 low.
The main resistance is near $160 and a connecting bearish trend line on the same chart. A clear break above the $155 and $160 resistance levels could start a decent recovery. In the mentioned case, the price could recover towards the $172 resistance.
On the downside, an immediate support is near the $150 level. If there is a downside break below the $150 support, the price is likely to retest $140.
Any further downsides may perhaps open the doors for a push towards the $132 and $130 support levels. The next major support is near the $125 level, where the bulls may emerge.
The above chart indicates that Ethereum price is under a lot of pressure below the $155 and $160 resistance levels. Overall, there are chances of more downsides below $150 and $140 in the near term.
Technical Indicators
4 hours MACD – The MACD for ETH/USD is slowly moving into the bullish zone.
4 hours RSI – The RSI for ETH/USD is currently recovering, but it is well below the 40 level.
Major Support Level – $140
Major Resistance Level – $160