
Reason to trust
How Our News is Made
Strict editorial policy that focuses on accuracy, relevance, and impartiality
Ad discliamer
Morbi pretium leo et nisl aliquam mollis. Quisque arcu lorem, ultricies quis pellentesque nec, ullamcorper eu odio.
- ETH price stayed above the $270-275 support and recently recovered higher against the US Dollar.
- Bitcoin price is currently trading above $11,000, but it is struggling to gain bullish momentum.
- There is a key breakout pattern forming with resistance near $295 on the 4-hours chart of ETH/USD (data feed via Kraken).
- The pair could either surpass $295 and $300 or it could extend losses below the $280 and $275 supports.
Ethereum price is likely preparing for the next move against the US Dollar, similar to bitcoin. ETH might climb high sharply once it clears the $295 and $300 resistance levels.
Ethereum Price Weekly Analysis
This past week, Ethereum price retested the $270-275 support area against the US Dollar. The ETH/USD pair remained stable above $270 and formed a swing low near the $272 level. Later, there was an upside correction above the $280 and $290 resistance levels. Moreover, the price also climbed above the $300 resistance level and the 100 simple moving average (4-hours).
The price even surpassed the 50% Fib retracement level of the downward move from the $324 high to $272 low. However, the price struggled to stay above the $300 support level. It was rejected near the 61.8% Fib retracement level of the downward move from the $324 high to $272 low. Later, there was a minor downside reaction below the $295 support level.
Besides, the price is currently trading below the $295 level and the 100 simple moving average (4-hours). At the outset, there is a key breakout pattern forming with resistance near $295 on the 4-hours chart of ETH/USD. If there is an upside break above the $295 and $300 resistance levels, Ethereum price could continue to accelerate higher in the near term. The next stop for the bulls could be $305, followed by $320.
Conversely, if there is no upside break above $300, the price could decline below the $285 support level. If there is a downside break, there could be sharp losses below the $280 and $275 levels. In the mentioned case, the price may even slide below the $270 support area.
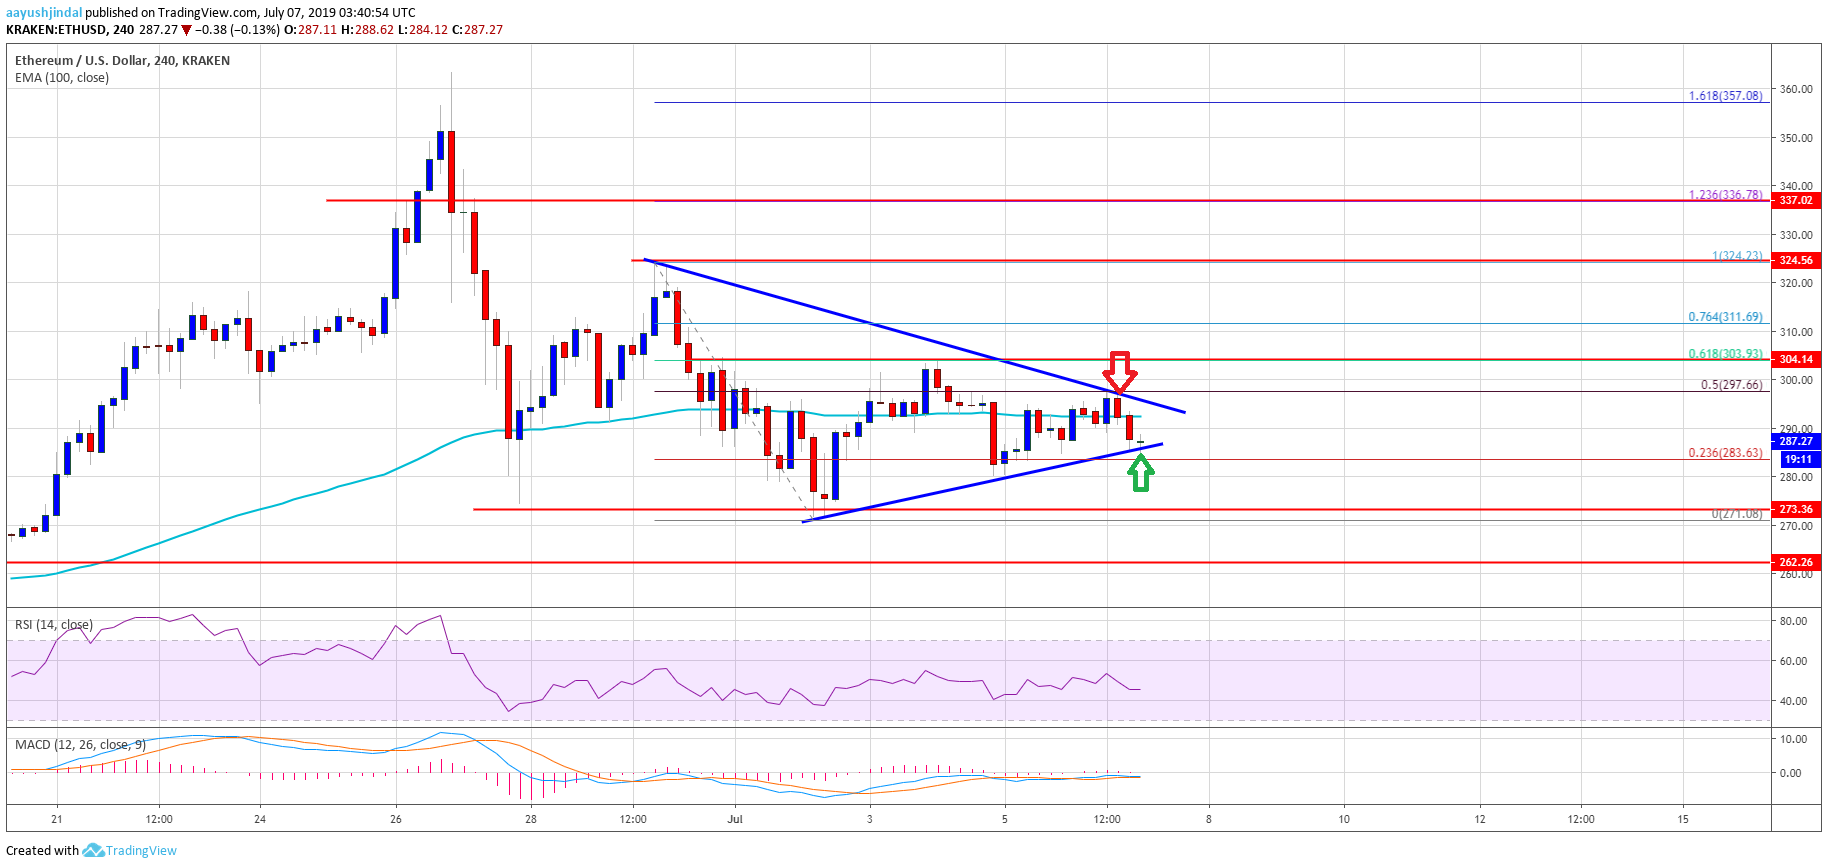
The above chart indicates that Ethereum price is preparing for the next key break either above the $300 barrier or below the $280 support area. Having said that, a clear break below the $270 support area won’t be easy in the coming sessions, whereas a close above $300 might accelerate gains.
Technical Indicators
4 hours MACD – The MACD for ETH/USD is slowly moving back in the bearish zone.
4 hours RSI – The RSI for ETH/USD is currently below the 50 level, with a few negative signs.
Major Support Level – $275
Major Resistance Level – $300