
Reason to trust
How Our News is Made
Strict editorial policy that focuses on accuracy, relevance, and impartiality
Ad discliamer
Morbi pretium leo et nisl aliquam mollis. Quisque arcu lorem, ultricies quis pellentesque nec, ullamcorper eu odio.
Chainlink (LINK) started a sharp decline from the $11.60 resistance zone. The price is now trading well below $10.50 and it seems like the bears are aiming a test of the $9.00 support.
- Chainlink token price started a major decline after it failed to clear the $11.60 resistance against the US dollar.
- The price is now trading below $10.20 and the 100 simple moving average (4-hours).
- There was a break below a crucial declining channel with support near $10.40 on the 4-hours chart of the LINK/USD pair (data source from Kraken).
- The current price action indicates chances of more downsides below $9.80 and $9.50.
Chainlink (LINK) Price Dives 10%
In the past few sessions, there was an increase in selling pressure on chainlink (LINK) from the $11.60 resistance. The price gained bearish momentum below the $11.20 and $11.00 support levels.
The bears remained in action, resulting in a break below the $10.50 support. Moreover, there was a break below a crucial declining channel with support near $10.40 on the 4-hours chart of the LINK/USD pair. The pair is now trading below $10.20 and the 100 simple moving average (4-hours).
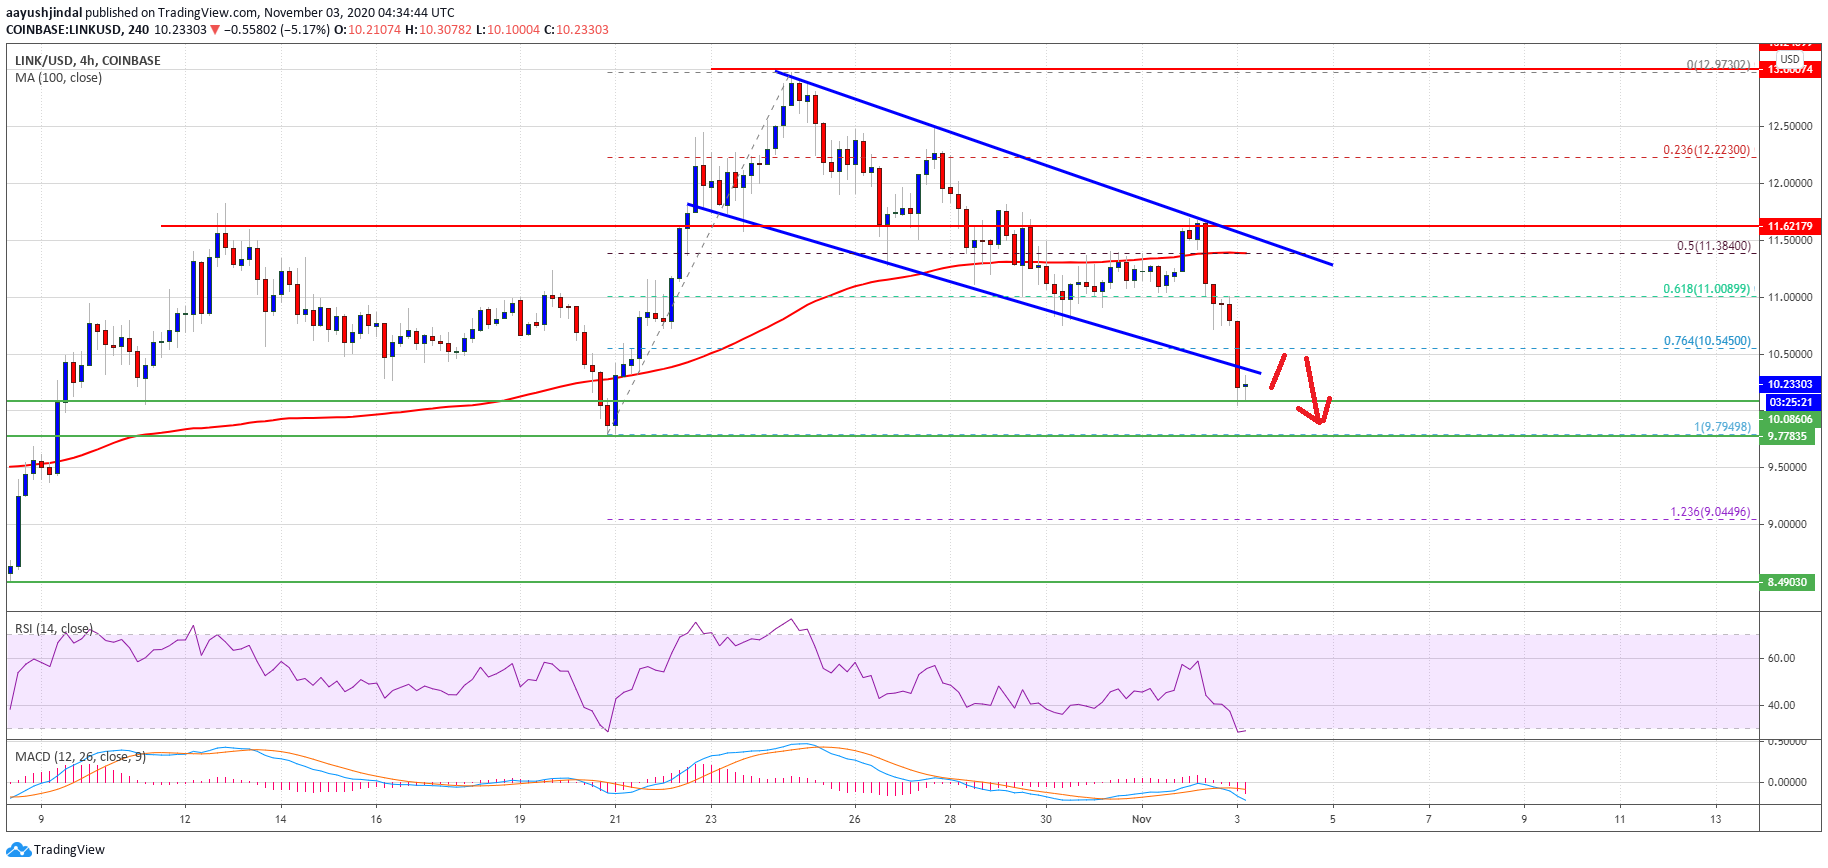
Source: LINKUSD on TradingView.com
It is also well below the 76.4% Fib retracement level of the upward move from the $9.79 swing low to $12.97 high. An initial support is near the $10.00 level, below which the price might find bids near the $9.79 swing low.
If there is a downside break below the $9.79 swing low, there is a risk of more losses below the $9.50 support. The next important support could be near the $9.00 level. It is close to the 1.236 Fib extension level of the upward move from the $9.79 swing low to $12.97 high.
Upsides Capped?
If chainlink’s price starts a corrective increase, it could face sellers near the broken channel support or the $10.50 level. The first key resistance on the upside is near the $10.80 level.
The next major resistance on the upside is near the $11.35 level, the 100 simple moving average (4-hours), and the channel trend line. A successful close above the $11.40 and $11.50 levels might could start a strong uptrend.
Technical Indicators
4-hours MACD – The MACD for LINK/USD is gaining pace in the bearish zone.
4-hours RSI (Relative Strength Index) – The RSI for LINK/USD is now well below the 40 level.
Major Support Levels – $10.00, $9.80 and $9.00.
Major Resistance Levels – $10.40, $10.50 and $11.35.


