
Reason to trust
How Our News is Made
Strict editorial policy that focuses on accuracy, relevance, and impartiality
Ad discliamer
Morbi pretium leo et nisl aliquam mollis. Quisque arcu lorem, ultricies quis pellentesque nec, ullamcorper eu odio.
Chainlink (LINK) started a sharp rise from the $10.00 support zone. It traded as high as $13.64, corrected lower, and now it is likely preparing for another leg higher over $13.00.
- Chainlink token price started a major upward move after it cleared the $11.50 resistance against the US dollar.
- The price traded as high as $13.64 and settled well above the 100 simple moving average (4-hours).
- There is a key contracting triangle forming with resistance near $12.70 on the 4-hours chart of the LINK/USD pair (data source from Kraken).
- The current price action indicates chances of a fresh rally above $12.70 and $13.00.
Chainlink (LINK) Signaling More Upsides
This past week, chainlink (LINK) formed a strong support base near $9.80 and $10.00. The price started a strong upward move (similar to bitcoin) and cleared the $11.00 resistance zone to move into a positive zone.
The bulls gained pace above the $11.50 resistance and the 100 simple moving average (4-hours). There was a break above the $13.00 resistance and the price traded to a new monthly high at $13.64.
Recently, there was a sharp downside correction below the $13.00 and $12.50 levels. The price traded below the 23.6% Fib retracement level of the upward move from the $9.75 swing low to $13.64 high. There was also a spike below $12.00, but the bulls defended the $11.80 support zone.
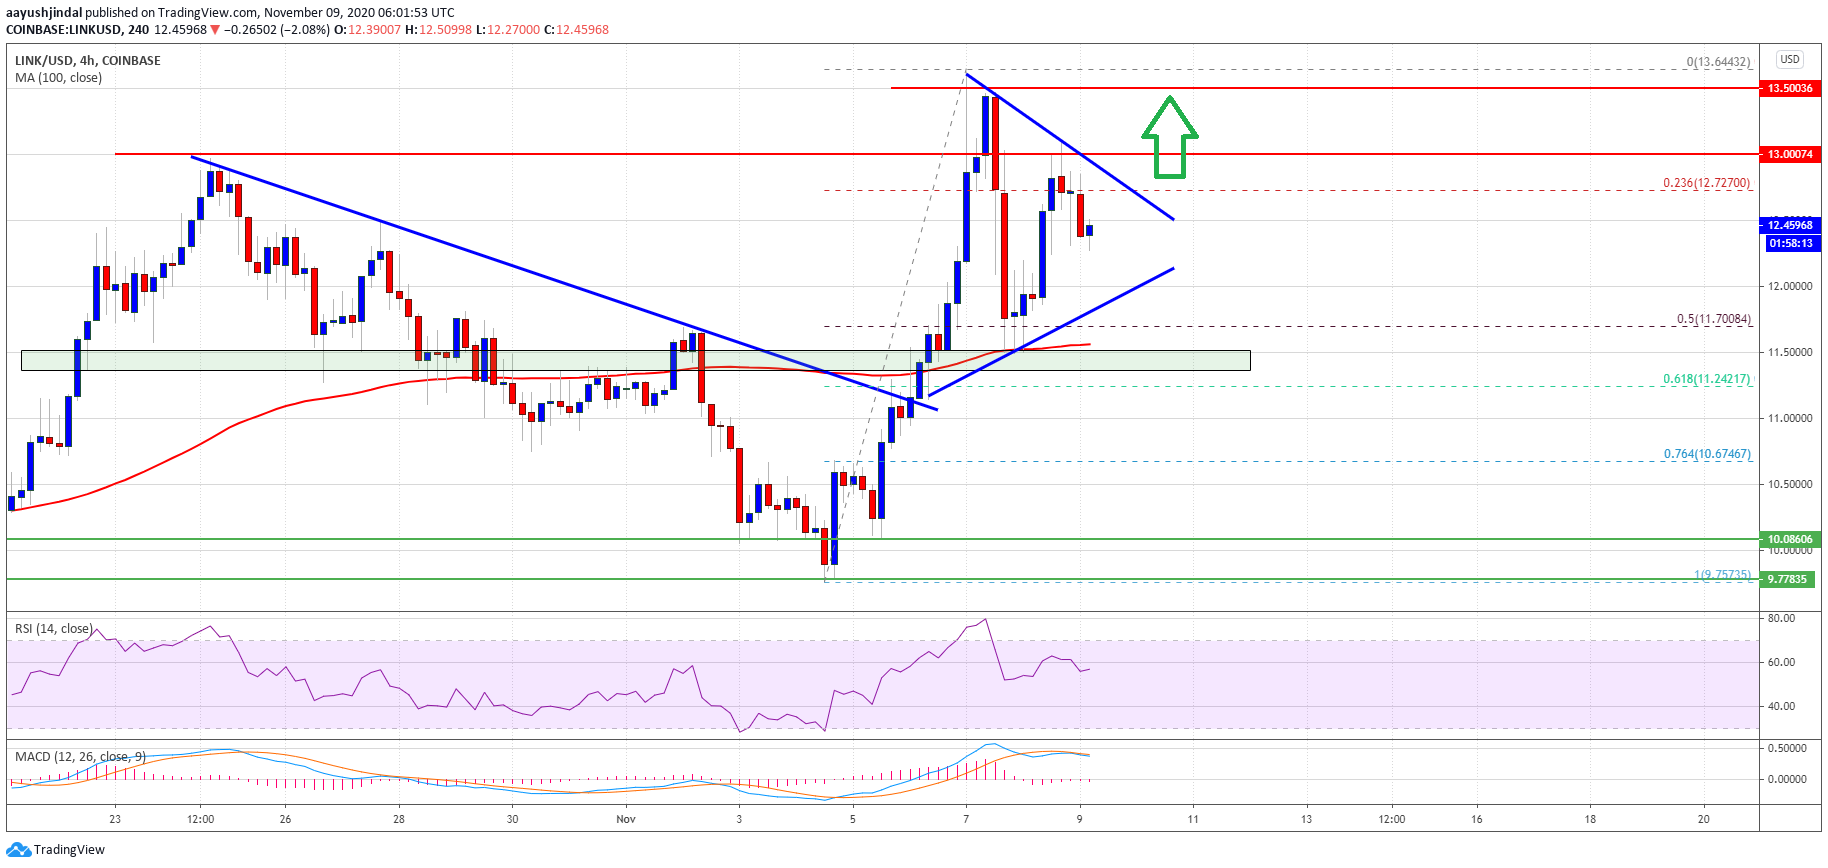
Source: LINKUSD on TradingView.com
The 100 simple moving average (4-hours), and the 50% Fib retracement level of the upward move from the $9.75 swing low to $13.64 high are also acting as strong supports.
It seems like there is a key contracting triangle forming with resistance near $12.70 on the 4-hours chart of the LINK/USD pair. If the pair breaks the triangle resistance, it is likely to start a fresh increase above the $13.00 resistance.
The next major resistance is near the $13.50 and $13.65 levels. Any further gains could lead the price towards the $14.00 resistance zone.
Downsides Limited?
An initial support for chainlink’s price is near the triangle lower trend line at $12.00. If there is a downside break below the triangle support, the price could revisit the $11.50 support.
The 100 simple moving average (4-hours) and the $11.50 support are very important. A clear close below $11.50 might push the price towards the $10.50 support zone.
Technical Indicators
4-hours MACD – The MACD for LINK/USD is likely to move back into the bullish zone.
4-hours RSI (Relative Strength Index) – The RSI for LINK/USD is still well above the 50 level.
Major Support Levels – $12.00, $11.60 and $11.50.
Major Resistance Levels – $12.70, $13.00 and $13.65.


