

Key Highlights
- Litecoin’s price looks like it has completed a correction phase, as sellers defended the upside near a major bearish trend line on the hourly chart (data feed from Bitfinex).
- If the price breaks the 100 hourly simple moving average, then a test of the last swing low of $3.26 is possible.
- There is an ascending channel formed on the hourly chart if we analyze the data feed provided by HitBTC.
Litecoin’s price bounced from the $3.20-30 support area, but found sellers near $3.60 that acted as a monster barrier for an upside move.
100 MA as a Support
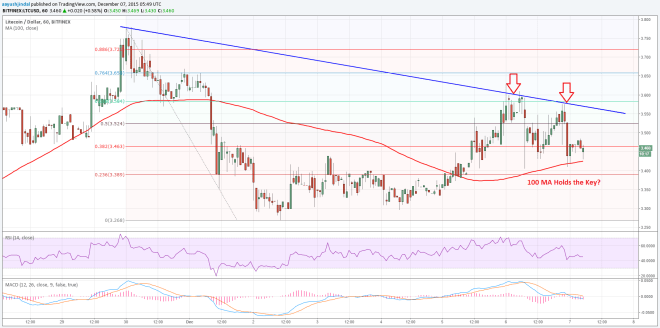

Litecoin prices recently moved closer to the 61.8% Fibonacci retracement level of the last drop from the $3.78 high to the $3.26 low, where it found resistance. The stated Fib level was also coinciding with a bearish trend line on the hourly chart (data feed from Bitfinex), which acted as a hurdle. The price is currently moving lower as buyers struggled to clear the trend line and resistance area.
However, there is a major support on the downside in the form of the 100 hourly simple moving average. As long as the price is above it, there is a chance of it moving back closer to the highlighted trend line and resistance area.
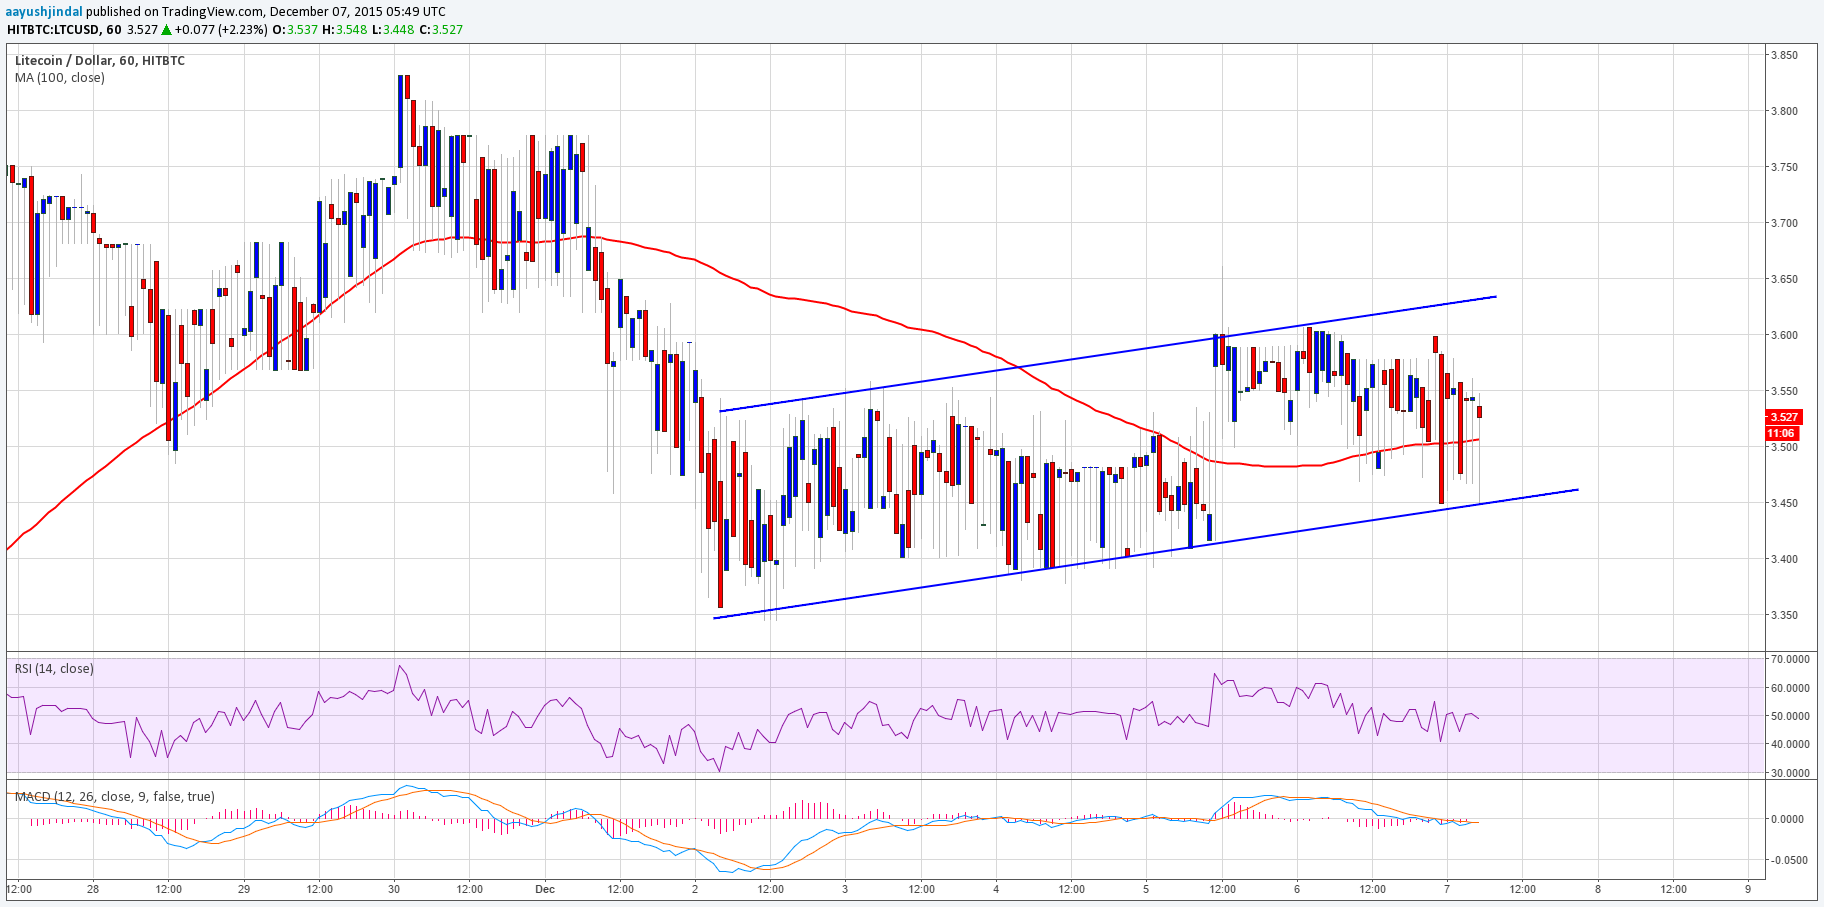
There are some positive signs as well for buyers, as the price is moving inside an ascending channel on the hourly chart (data feed from HitBTC). If buyers gain momentum, there is a possibility that the price may spike higher. The next level of interest on the upside could be around $3.80.
Looking at the indicators:
MACD – The hourly MACD is in the bearish slope, pointing to more losses.
Hourly RSI – The hourly RSI is below the 50 level, which is another bearish sign.
Intraday Support Level – $3.30
Intraday Resistance Level – $3.50-60
Charts from Bitfinex and HitBTC; hosted by Trading View