

Key Highlights
- Litecoin prices remained bullish, and traded higher back towards the last swing high of $3.80-$3.85.
- There is a crucial trend line and support area formed on the hourly chart (data feed from Bitfinex), which may be considered a buy zone.
- However, for an upside move, buyers have to clear the $3.80-$3.85, or else there lies a risk of a downside break.
Litecoin’s price is likely approaching a short-term break. As long as the price is above the 100-hour moving average, buyers remain in control.
Downside Push Ahead?
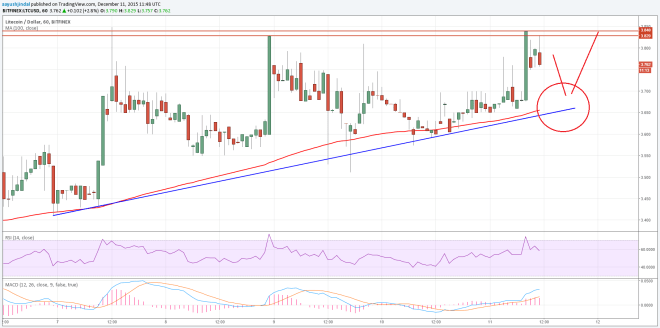

Litecoin prices spiked intraday, as there was a sharp reaction around yesterday’s highlighted bullish trend line on the hourly chart (data feed from Bitfinex). The most critical aspect is the fact that the 100-hour simple moving average is positioned with the highlighted trend line. The price is currently near the last high of $3.80-$3.85, which is acting as a resistance. A break above the same is needed for more gains, possibly towards $4.
There is a chance that the price will dive one more time to retest the trend line and support area before it climbs back higher. If we look at the 30-minute chart with the data feed from HitBTC, there is an ascending channel pattern forming.
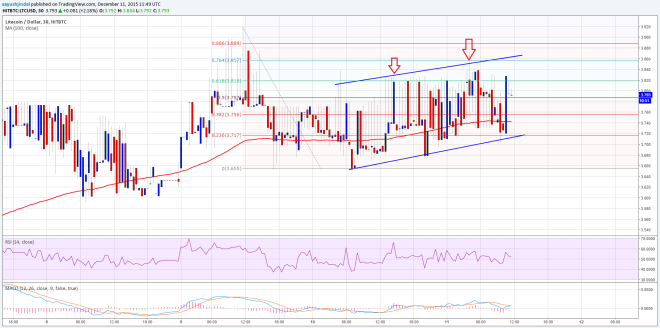
The channel resistance area is also around the $3.80-$3.85 resistance area. It looks like the 76.4% Fibonacci level of the last drop from the $3.92 high to the $3.65 low may act as a pivot area. Overall, we can wait for a break in the short term for the next leg.
Looking at the Indicators
30-minute MACD – The MACD is in the bullish zone, suggesting more gains moving ahead.
30-minute RSI – The RSI is moving away from the overbought levels, which is a sign of a minor correction.
Intraday Support Level – $3.65
Intraday Resistance Level – $3.80
Charts from Bitfinex and HitBTC; hosted by Trading View