Litecoin is currently down 1.38 percent at $2.781 as the Bitcoin market registers a breakdown.
As mentioned in the previous Litecoin price technical analysis No Trading Zone, market participants have their eyes now set on $2.700, the level which had acted as a support in the past. And further weakness in the Bitcoin market may lead to a breakdown kind of situation in Litecoin as well.
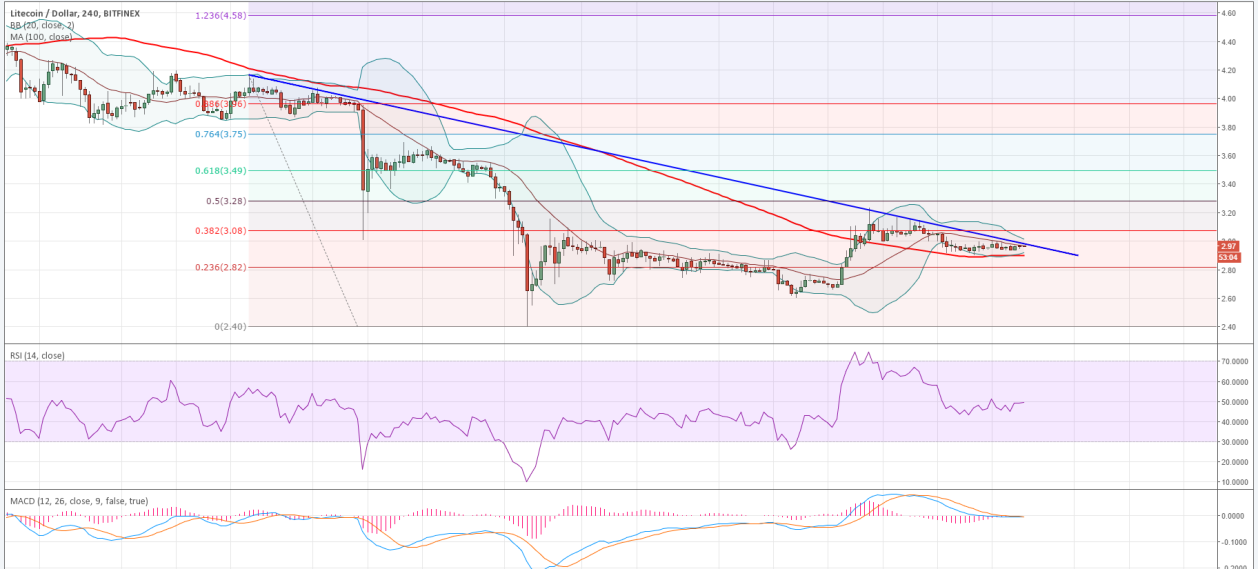

Image: https://www.tradingview.com/x/of97bhcV/
Here are the latest technical points from the daily LTC-USD price chart.
Litecoin Chart Structure – As can be seen, Litecoin remains capped under the influence of the 30-day simple moving average, the current value of which is $2.8456. Upon further pressure, Litecoin may break the near-term support of $2.700.
Moving Average Convergence Divergence – The MACD and Signal Line are slowly and steadily marching up, erasing their losses and keeping the Histogram afloat in the positive territory. In a way, this is a divergence in itself considering the recent string of losses that Litecoin has witnessed.
Momentum – The Momentum reading has also advanced rather than declined during yesterday’s drop. The value is now -0.0104.
Money Flow Index – The MFI is, however, depicting a strong departure from the above technical indicators. It is showing a higher degree of weakness in Litecoin with its value of 32.4913.
Relative Strength Index – The 14-day RSI provides no useful insight with its value of 40.0545.
Conclusion
There is a simple explanation to all of this! Litecoin market is being highly resilient to the external pressure (cast from the Bitcoin market) and is therefore, unable to provide decisive directional and trading signals.
But, I am not expecting this consolidation to last for too long now. Traders should create short positions if the support of $2.700 is breached for a target of $2.500 by maintaining the then-current value of the 30-day simple moving average as the stop-loss.