

Key Highlights
- Litecoin price formed a major triangle pattern on the hourly chart (data feed via Bitfinex), and we were waiting for a break to buy Litecoins.
- A break happened Intraday, and the price traded higher towards the $3.30 resistance area.
- The price stalled right near a major bearish trend line, as highlighted yesterday on the 2-hours chart (data feed from HitBTC).
Litecoin price traded higher to help buyers gain some traction. Our buy target was hit and moving ahead we can plan on buying dips.
Buy dips?
Yesterday, I mentioned that buying with a break can be a good idea. There were many sells earlier, which we succeeded. However, the sellers were exhausted, and it was the right time to place a buy order. There was a triangle pattern on the hourly chart (data feed via Bitfinex), and we were waiting for a close above it to enter a buy trade. The price did close above it and even traded above the 6.4% Fib retracement level of the last leg from the $3.20 high to $3.07 low. A new weekly high was created near $3.30 (data feed via Bitfinex) before the price started correcting lower once again.
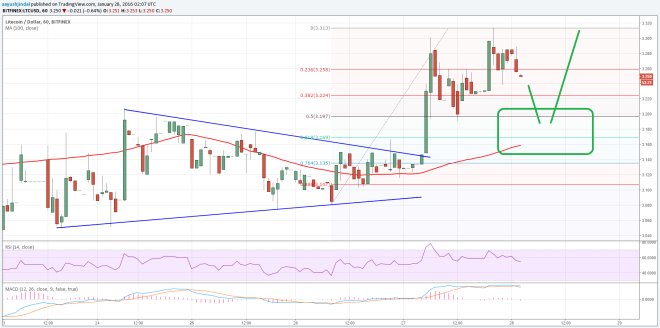

The most important point to note that the price closed above the 100 hourly simple moving average (data feed via Bitfinex), suggesting that the recent break was crucial. The price is currently correcting lower, and it looks like it may extend correction. However, we can wait for the right time to analyze and enter a buy trade one dips moving ahead. An initial support can be seen around the 50% Fib retracement level of the last leg from the $3.08 low to $3.31 high. If the price extends the downside. The most important support can be around the 100 hourly simple moving average, which is sitting near the 61.8% Fib retracement level of the last leg from the $3.08 low to $3.31 high. Buyers may take a stand near the 100 MA and the stated fib confluence area, and we may attempt a small buy around the highlighted support area.
If we look at the higher time frame chart like the 2-hours chart with the data feed from HitBTC, then the price recently found resistance near a major bearish trend line, which we have been following for a couple of days now. The highlighted trend line and resistance area suggest that the price may move down in the near term as a part of a correction.
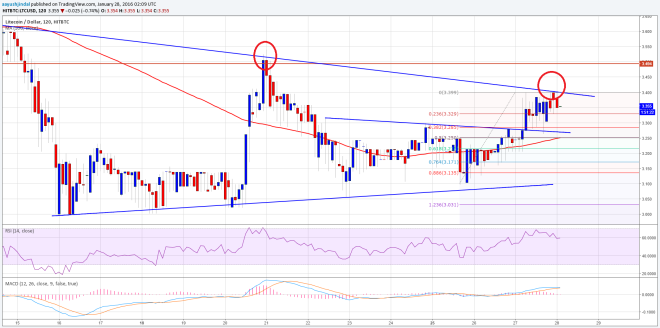
On the downside, the 38.2% Fib retracement level of the last leg from the $3.10 low to $3.39 high can act as a support area. The stated fib level is positioned near a previous broken trend line. So, overall there is a nice support forming near $3.25 where buyers may appear if the price moves down from the current levels.
Looking at the indicators:
Hourly MACD – The MACD is in the bearish sign, calling for a downside move in the short term.
Hourly RSI – The RSI is above the 50 level, which is a positive sign for bulls.
Intraday Support Level (Bitfinex) – $3.20
Intraday Resistance Level (Bitfinex) – $3.32
Charts from Bitfinex and HitBTC; hosted by Trading View