

- Ripple price is gaining bullish momentum above the $0.3100 and $0.3120 resistances against the US dollar.
- The price is placed nicely in a bullish zone, with resistances near $0.3140 and $0.3170.
- There is a decent connecting bullish trend line forming with support at $0.3100 on the hourly chart of the XRP/USD pair (data source from Kraken).
- The pair is following a bullish path and there high chances of a run towards $0.3200 and $0.3250.
Ripple price is trading with bullish moves against the US Dollar and bitcoin. XRP is showing positive signs on charts and it could soon climb higher towards $0.3200 or even $0.3250.
Ripple Price Analysis
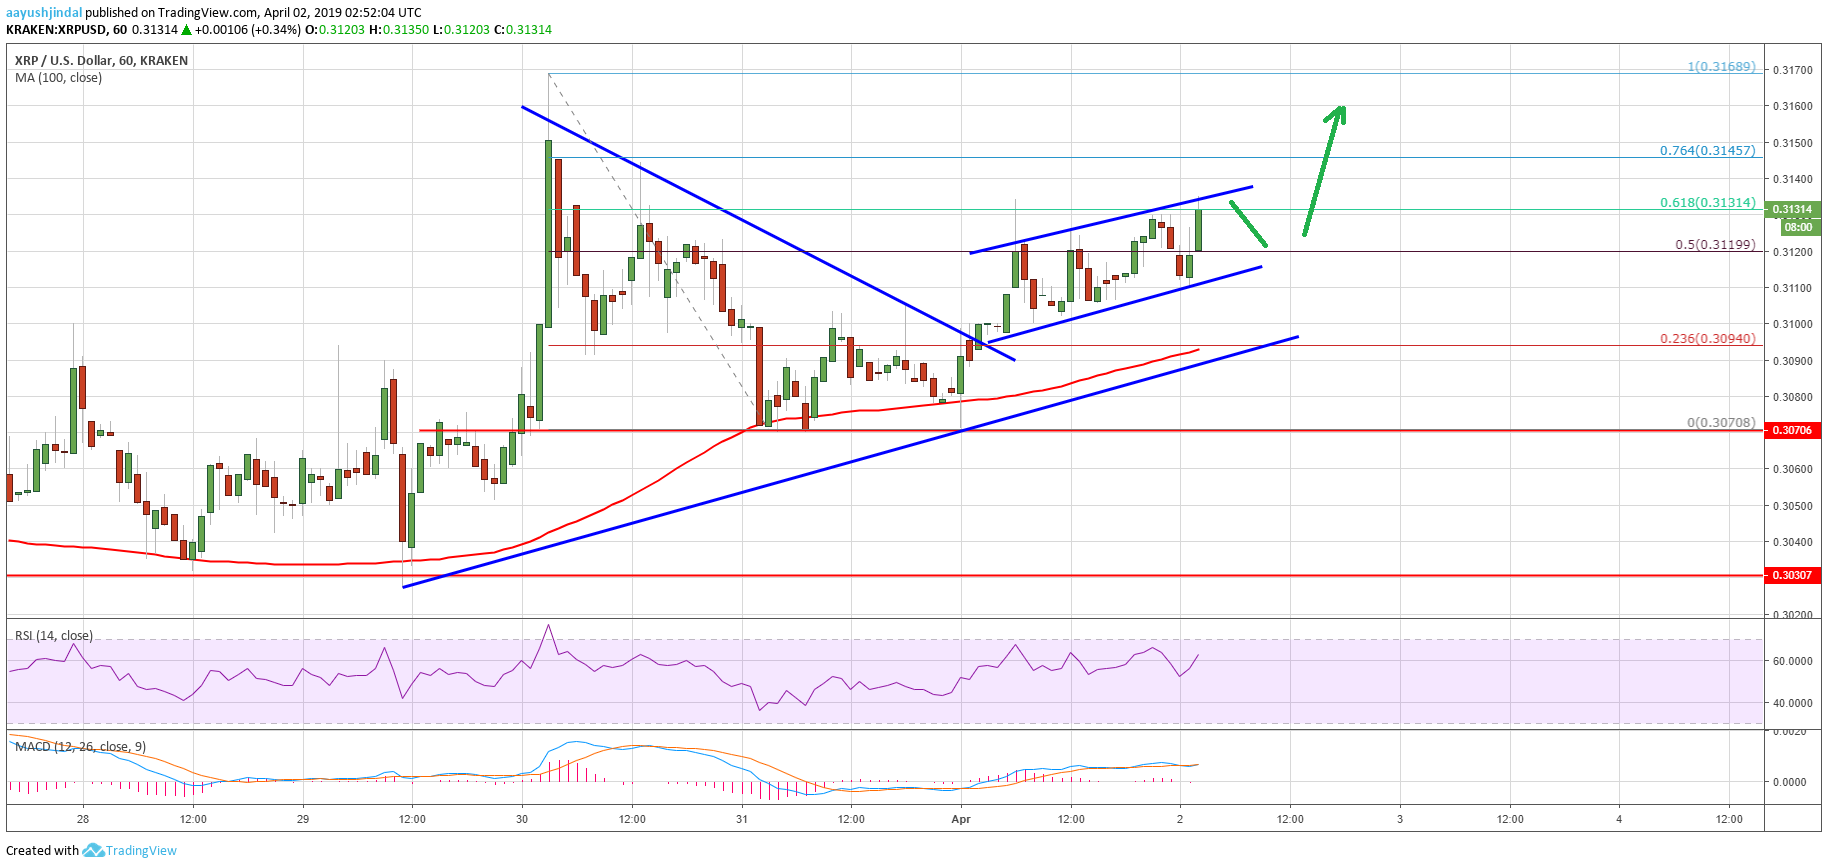
Yesterday, we saw a downside correction from the $0.3168 swing high in ripple price against the US Dollar. The XRP/USD pair traded below the $0.3100 support and the $0.3080 pivot level. However, the $0.3020 level acted as a strong support along with the 100 hourly simple moving average. A swing low was formed at $0.3070 and later the price bounced back. It broke the $0.3100 resistance and settled well above the 100 hourly simple moving average.
During the recent rise, the price broke a connecting bearish trend line with resistance at $0.3095 on the hourly chart. It opened the doors for more gains above the $0.3110 level. The price cleared the 50% Fib retracement level of the last drop from the $0.3170 swing high to $0.3070 low. Buyers pushed the price above the $0.3120 level. At present, the price is testing the 61.8% Fib retracement level of the last drop from the $0.3170 swing high to $0.3070 low. There is also a short term ascending channel in place with resistance at $0.3140.
Therefore, a successful close above the $0.3140 resistance might push the price towards the $0.3170 swing high. The next stop for buyers could be $0.3200, which is a significant resistance. A clear break above the $0.3200 level may set the pace for a rally towards the $0.3250 level. On the downside, there is a strong support formed near the $0.3100 level. There is also a decent connecting bullish trend line forming with support at $0.3100 on the same chart.

Looking at the chart, ripple price is clearly trading in a bullish zone, with resistances near $0.3140 and $0.3170. It might trade in a range for a few hours, but buyers are likely to push the price above $0.3140 and $0.3170.
Technical Indicators
Hourly MACD – The MACD for XRP/USD is slowly moving in the bullish zone.
Hourly RSI (Relative Strength Index) – The RSI for XRP/USD is currently placed nicely above the 55 level.
Major Support Levels – $0.3110, $0.3100 and $0.3090.
Major Resistance Levels – $0.3140, $0.3170 and $0.3200.