

- Ripple price failed to recover and extended losses below the $0.3100 support against the US dollar.
- The price settled below the $0.3100 support and the 100 hourly simple moving average.
- Yesterday’s major contracting triangle was breached with support at $0.3095 on the hourly chart of the XRP/USD pair (data source from Kraken).
- The pair could decline towards the $0.3000 support where buyers are likely to emerge.
Ripple price is grinding lower towards key supports against the US Dollar and bitcoin. XRP/USD is likely to find a strong buying interest near the $0.3000 support level in the near term.
Ripple Price Analysis
After ripple price failed to break the $0.3160 resistance, it started a fresh decline against the US Dollar. The XRP/USD pair declined and broke the $0.3120 and $0.3100 support levels. There was even a close below the $0.3100 support and the 100 hourly simple moving average. Later, the price found support near the $0.3070 level and recovered above $0.3100. However, the $0.3140 level acted as a resistance and the price moved lower once again. It broke the 76.4% Fib retracement level of the last wave from the $0.3076 low to $0.3158 high.
Moreover, yesterday’s major contracting triangle was breached with support at $0.3095 on the hourly chart of the XRP/USD pair. The pair even broke the $0.3076 swing low and the $0.3070 support level. At the moment, the price is trading near the 1.236 Fib extension level of the last wave from the $0.3076 low to $0.3158 high. Therefore, there is a risk of more losses below the $0.3050 support level.
On the upside, the previous supports at $0.3075 and $0.3100 are likely to act as resistances. Besides, the 100 hourly SMA is also near the $0.3100 level to prevent gains. If there is a successful close above the $0.3100 resistance, the price could recover towards the $0.3140 resistance. On the downside, the next support is at $0.3025. It represents the 1.618 Fib extension level of the last wave from the $0.3076 low to $0.3158 high. The main support is at $0.3000, where buyers are likely to take a stand in the near term.
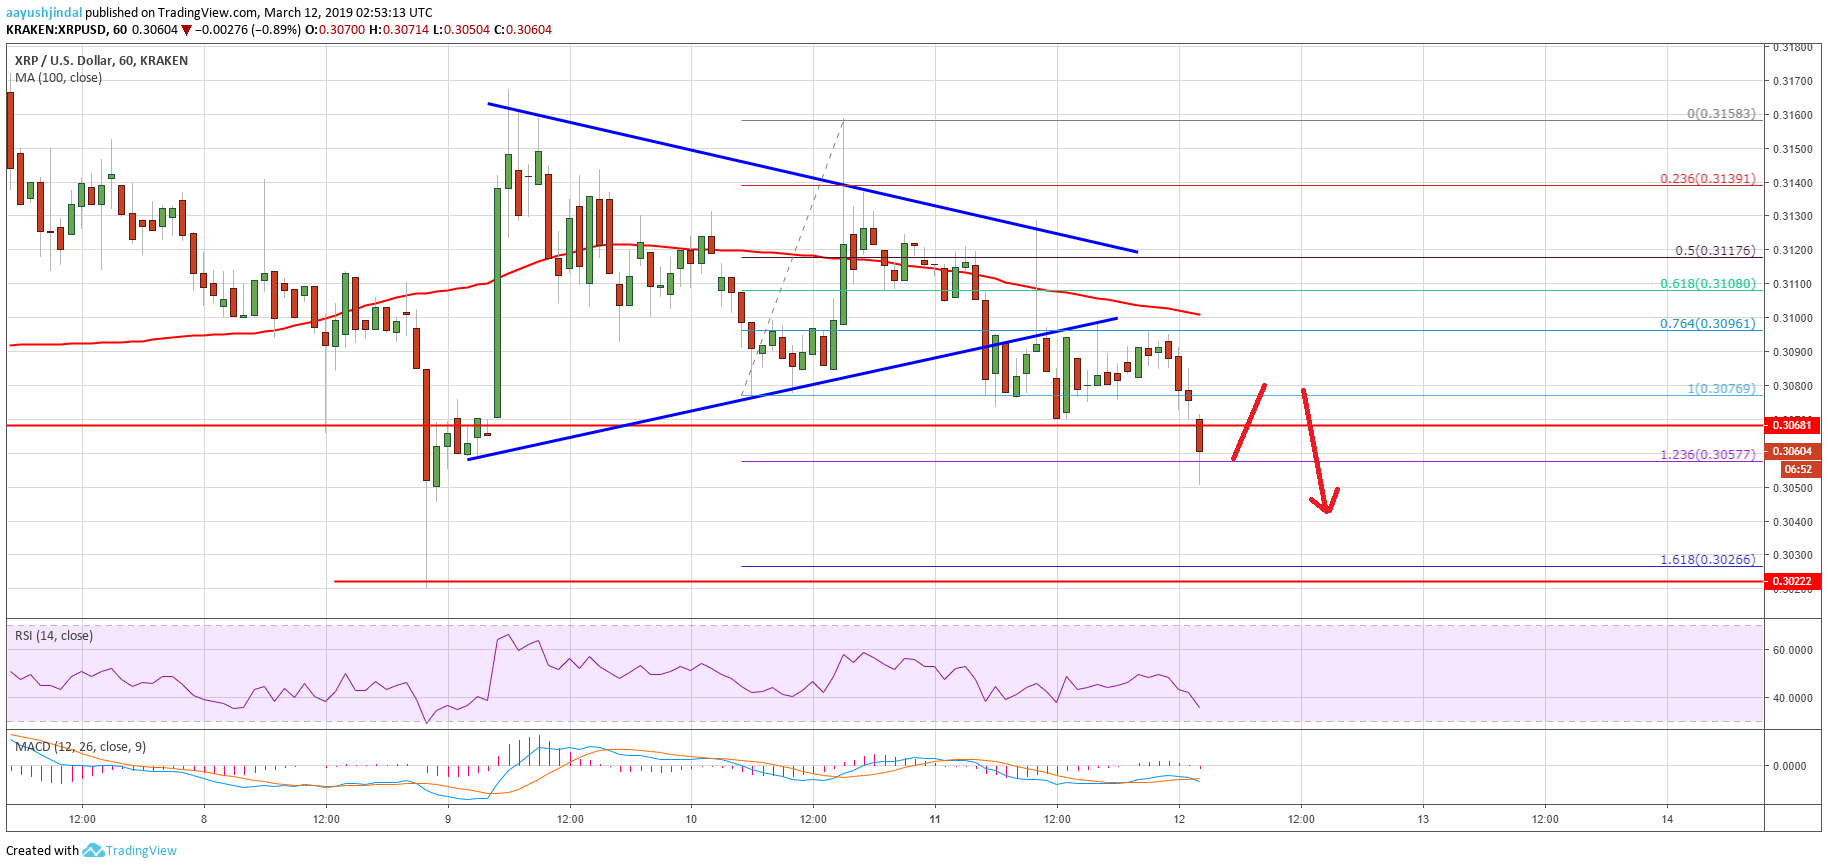

Looking at the chart, ripple price is trading in a bearish zone below the $0.3100 resistance. There is a clear risk of more losses below $0.3050. Having said that, the $0.3025 or $0.3000 support is likely to act as a strong buy zone in the coming sessions.
Technical Indicators
Hourly MACD – The MACD for XRP/USD is gaining momentum in the bullish zone.
Hourly RSI (Relative Strength Index) – The RSI for XRP/USD declined heavily below 40 and it is approaching 30.
Major Support Levels – $0.3040, $0.3025 and $0.3000.
Major Resistance Levels – $0.3075, $0.3095 and $0.3100.