

- Ripple price failed to break the $0.3075 and $0.3100 resistance levels against the US dollar.
- There was a break below a major bullish trend line with support at $0.3050 on the hourly chart of the XRP/USD pair (data source from Kraken).
- The pair remains at a risk of more losses below the $0.2960 and $0.2940 support levels in the near term.
Ripple price is under bearish pressure against the US Dollar and Bitcoin. XRP/USD sellers are in control and they seem to eyeing a test of the $0.2900 zone in the coming sessions.
Ripple Price Analysis
This past week, there was a sharp rise in ripple price above the $0.3300 resistance against the US Dollar. The XRP/USD pair traded as high as $0.3336 and later corrected lower. It declined below $0.3200 support to move into a bearish zone. The price even broke the $0.3000 support before buyers appeared near the $0.2940 level. Later, there was an upside correction above the $0.3050 level. Buyers pushed the price above the 23.6% Fib retracement level of the last decline from the $0.3336 high to $0.2940 low. However, the price struggled to break the $0.3100 resistance, resulting in bearish moves.
There was also no test of the 50% Fib retracement level of the last decline from the $0.3336 high to $0.2940 low. The price moved down and broke the $0.3050 support plus the 100 hourly simple moving average. Moreover, there was a break below a major bullish trend line with support at $0.3050 on the hourly chart of the XRP/USD pair. The current price action is bearish and ripple is trading well below the $0.3000 level. An immediate support is near the $0.2940 level, below which there is a risk of more losses towards $0.2900.
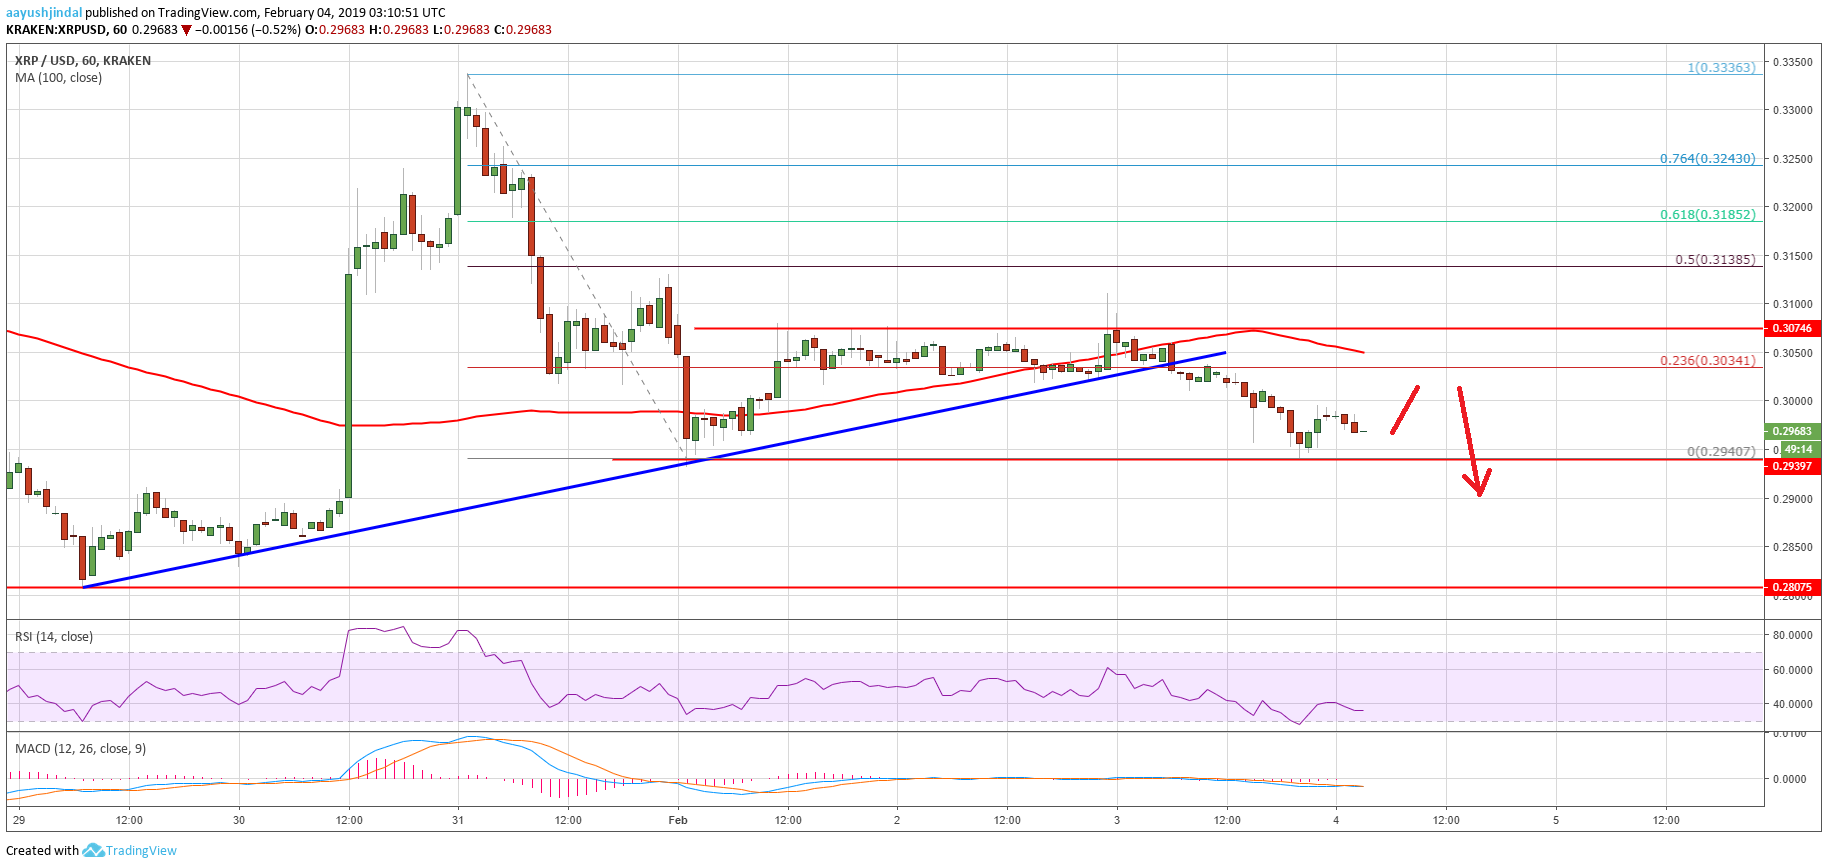

Looking at the chart, ripple price is clearly trading in a bearish zone below the $0.3050 support plus the 100 hourly simple moving average. Therefore, sellers could eye a downside extension below $0.2940 and $0.2920.
Technical Indicators
Hourly MACD – The MACD for XRP/USD is mostly flat with chances of strength in the bearish zone.
Hourly RSI (Relative Strength Index) – The RSI for XRP/USD is now well below the 40 level.
Major Support Level – $0.2940
Major Resistance Level – $0.3050