

- Ripple price corrected higher, but it failed to move above $0.2900 and $0.2920 against the US dollar.
- Yesterday’s highlighted key bearish trend line is intact with resistance near $0.2890 on the hourly chart of the XRP/USD pair (data source from Kraken).
- The pair must break the $0.2900 and $0.2920 resistance levels to start a short term upward move.
Ripple price is trading in a bearish zone with a negative angle against the US Dollar and Bitcoin. XRP/USD could continue to move down and it may even break the $0.2850 support level.
Ripple Price Analysis
After trading as low as $0.2850, ripple started a minor upside correction against the US Dollar. The XRP/USD pair traded above the $0.2860 and $0.2880 resistance levels. It also moved above the 23.6% Fib retracement level of the recent decline from the $0.2987 high to $0.2849 low. However, there was a strong rejection near the $0.2910 and $0.2920 resistance levels. The price even failed to test the $0.2930 pivot level and later traded in a tight range. More importantly, it slowly traded lower and settled below $0.2900 plus the 100 hourly simple moving average.
On the upside, there are many hurdles near the $0.2900 and $0.2920 levels. Besides, yesterday’s highlighted key bearish trend line is intact with resistance near $0.2890 on the hourly chart of the XRP/USD pair. The 50% Fib retracement level of the recent decline from the $0.2987 high to $0.2849 low is also near $0.2918. Therefore, the price is likely to struggle near the $0.2900 and $0.2920 resistance levels. On the downside, an initial support is at $0.2850, below which there is a risk of a drop to $0.2800.
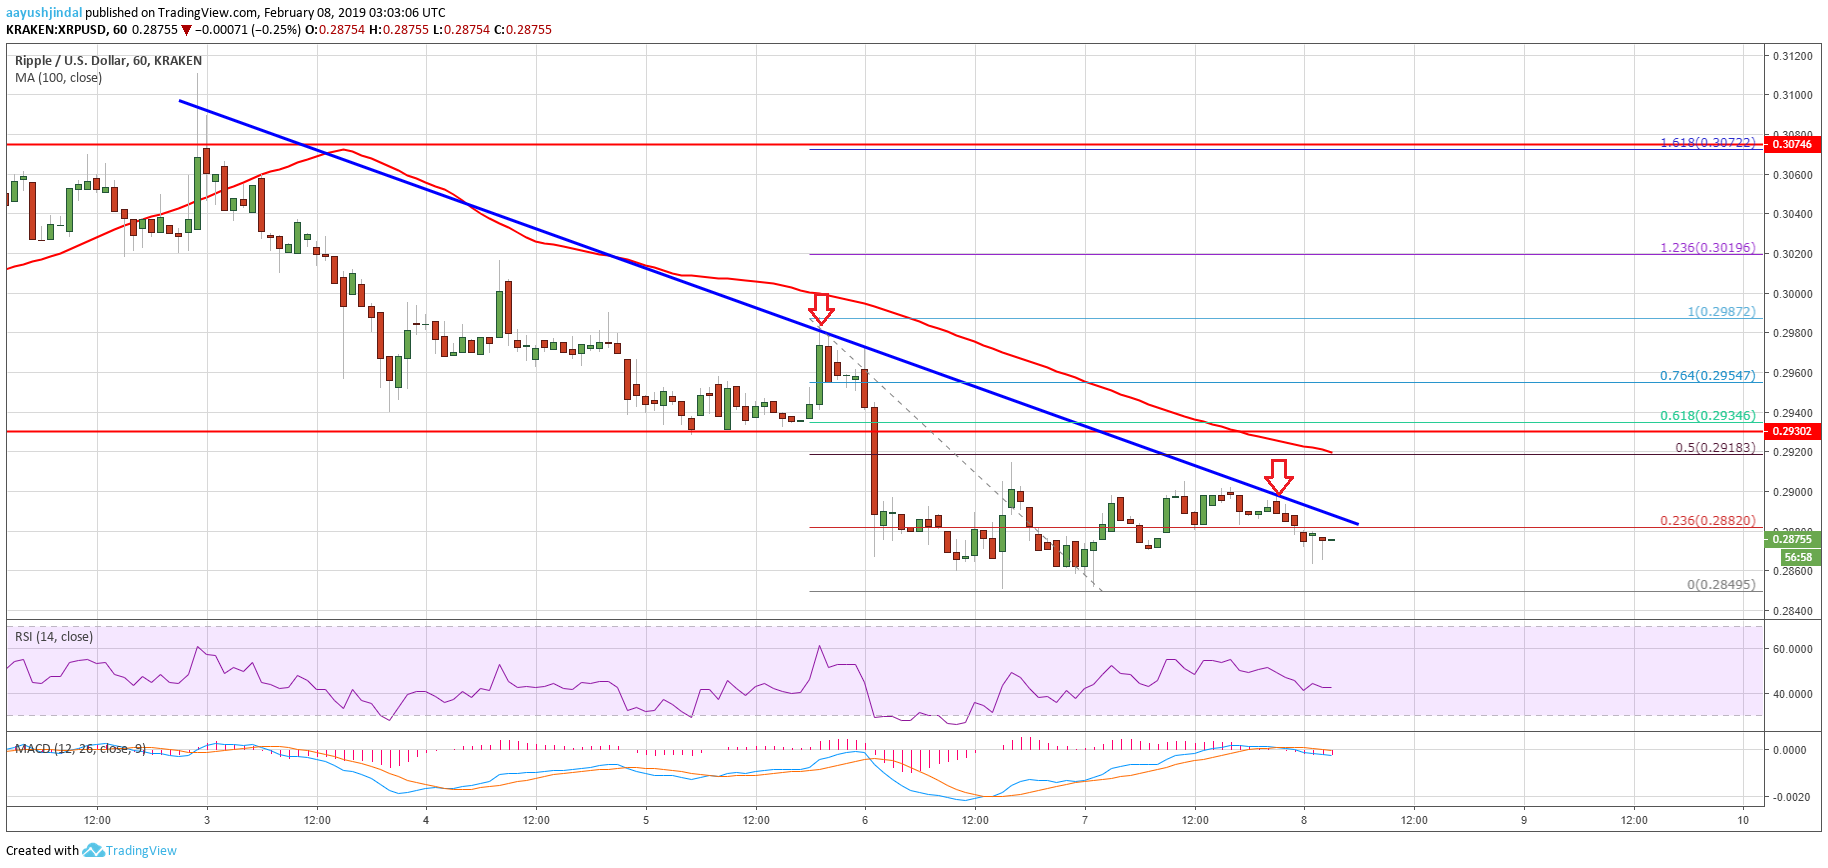

Looking at the chart, ripple price is clearly placed in a bearish zone below $0.2920. As long as the price is below the $0.2930 pivot, sellers remain in action. They could soon push the price below $0.2850 and $0.2820 in the near term.
Technical Indicators
Hourly MACD – The MACD for XRP/USD is slowly gaining pace in the bearish zone.
Hourly RSI (Relative Strength Index) – The RSI for XRP/USD is back below the 50 and 45 levels, with bearish signs.
Major Support Level – $0.2850
Major Resistance Level – $0.2920