

- Ripple price faced a strong resistance near the $0.3330 level and declined sharply against the US dollar.
- There is a major bullish trend line in place with support at $0.2920 on the hourly chart of the XRP/USD pair (data source from Kraken).
- The pair could either climb back above the $0.3050 resistance or extend the current decline below $0.2900.
Ripple price failed to hold gains and declined heavily against the US Dollar and Bitcoin. XRP/USD remains at a risk of more losses as long as it is below $0.3050 and $0.3120.
Ripple Price Analysis
Yesterday, we saw a solid rally in ripple price above the $0.3200 resistance against the US Dollar. The XRP/USD pair even broke the $0.3300 resistance and the 100 hourly simple moving average. However, the price faced a strong resistance near the $0.3330 level and later declined sharply. It broke many supports, including $0.3300, $0.3250, $0.3150 and $0.3050. There was also a break below the 61.8% Fib retracement level of the last leg from the $0.2771 low to $0.3338 high. Moreover, there was a close below the $0.3050 support and the 100 hourly SMA.
At the moment, the price is trading just above the $0.2900 and $0.2920 supports. Besides, there is a major bullish trend line in place with support at $0.2920 on the hourly chart of the XRP/USD pair. The 76.4% Fib retracement level of the last leg from the $0.2771 low to $0.3338 high is also near $0.2905. Therefore, if there is a bearish break below $0.2920 and $0.2905, there could be a sharp decline. The next key support is at $0.2800, below which the price may test $0.2650. On the upside, the price has to break the $0.3050 resistance to avoid further losses.
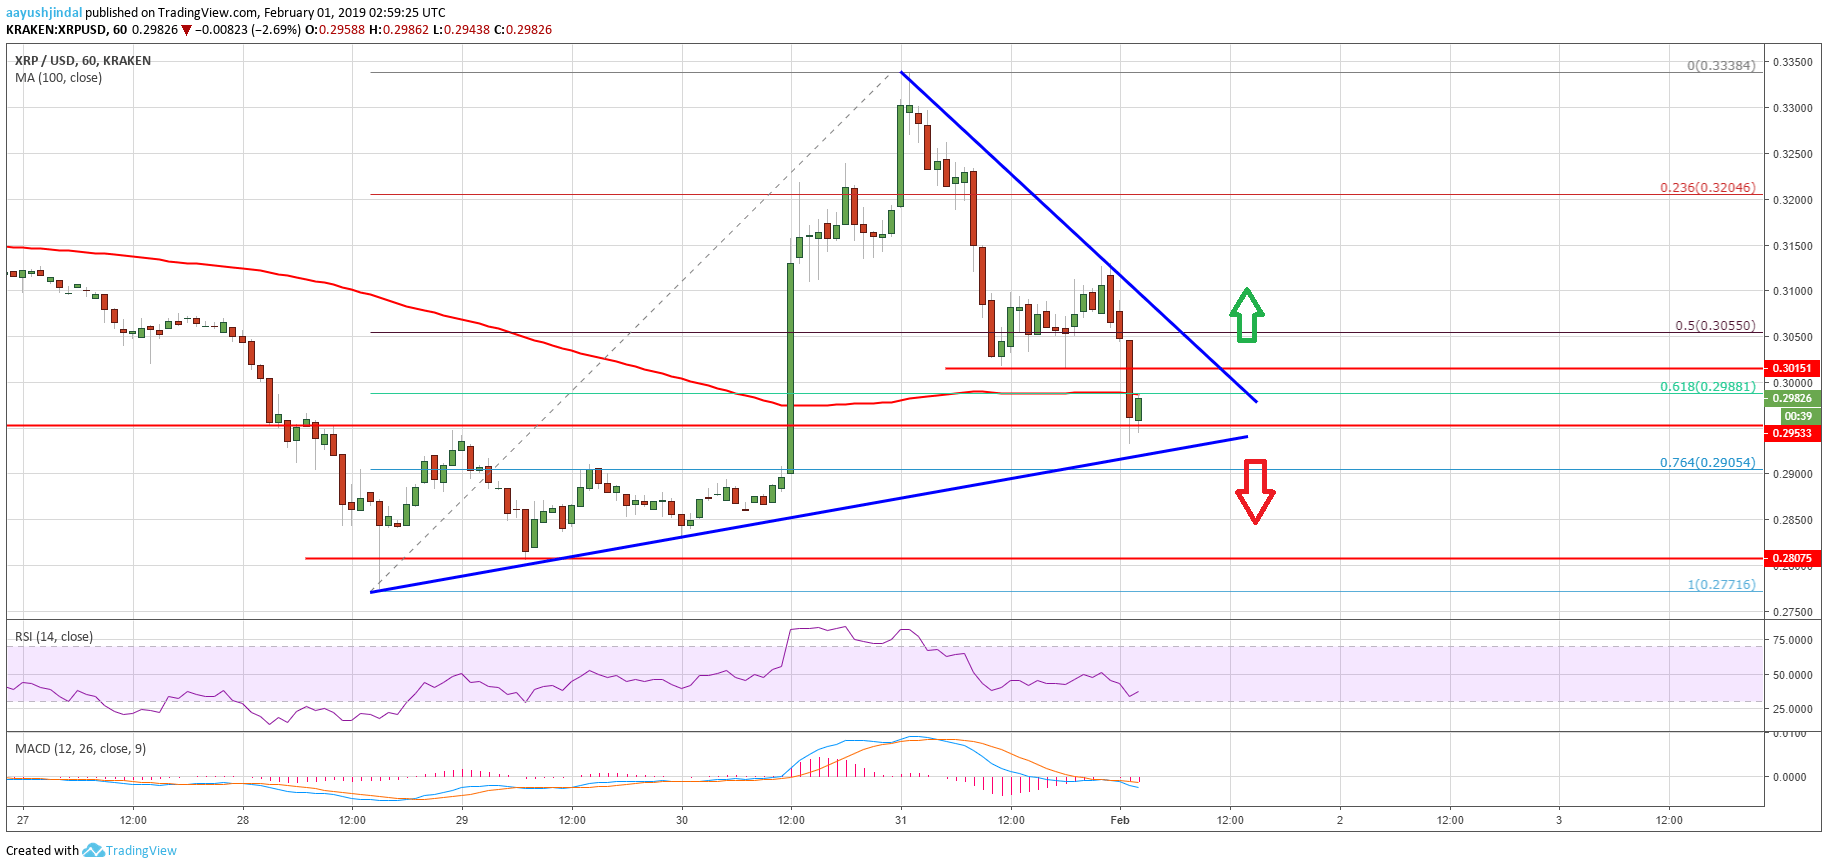

Looking at the chart, ripple price could either surge above the $0.3050-$0.3120 resistance or extend the current decline. A daily close below $0.2900 might put a lot of pressure on buyers in the short term.
Technical Indicators
Hourly MACD – The MACD for XRP/USD is showing a few positive signs in the bullish zone.
Hourly RSI (Relative Strength Index) – The RSI for XRP/USD is currently well below the 50 level.
Major Support Level – $0.2905
Major Resistance Level – $0.3120