

- Ripple price is currently showing a few positive signs above the $0.2980 support against the US dollar.
- Yesterday’s highlighted key declining channel is intact with resistance near $0.3035 on the hourly chart of the XRP/USD pair (data source from Kraken).
- The pair is likely to break the $0.3040 and $0.3060 resistance levels for a fresh upward move.
Ripple price is slowly recovering against the US Dollar and Bitcoin. XRP/USD could gain bullish momentum once it breaks the $0.3040 and $0.3060 resistance levels.
Ripple Price Analysis
In the past few days, there was a steady decline in ripple price from the $0.3180 swing high against the US Dollar. The XRP/USD pair traded below the $0.3120 and $0.3040 support levels. It even traded below the $0.3000 support to move into a bearish zone. There was a dip towards the $0.2940 level and the price settled below the 100 hourly simple moving average. A low was formed at $0.2939 and later the price started a short-term rebound. The price climbed above the $0.2980 resistance, with bullish moves.
The price even traded above the $0.3000 level, but the upside move was capped by the $0.3040 resistance. More importantly, yesterday’s highlighted key declining channel is intact with resistance near $0.3035 on the hourly chart of the XRP/USD pair. The pair traded as high as $0.3041 and it is currently trading near the 100 hourly SMA. An initial support is near $0.2990 and the 50% Fib retracement level of the recent wave from the $0.2939 low to $0.3041 high. However, the main support is near $0.2980 and the 61.8% Fib retracement level of the recent wave from the $0.2939 low to $0.3041 high. Therefore, if there is a downside correction, the price might find support near $0.3000, $0.2990 or $0.2980.
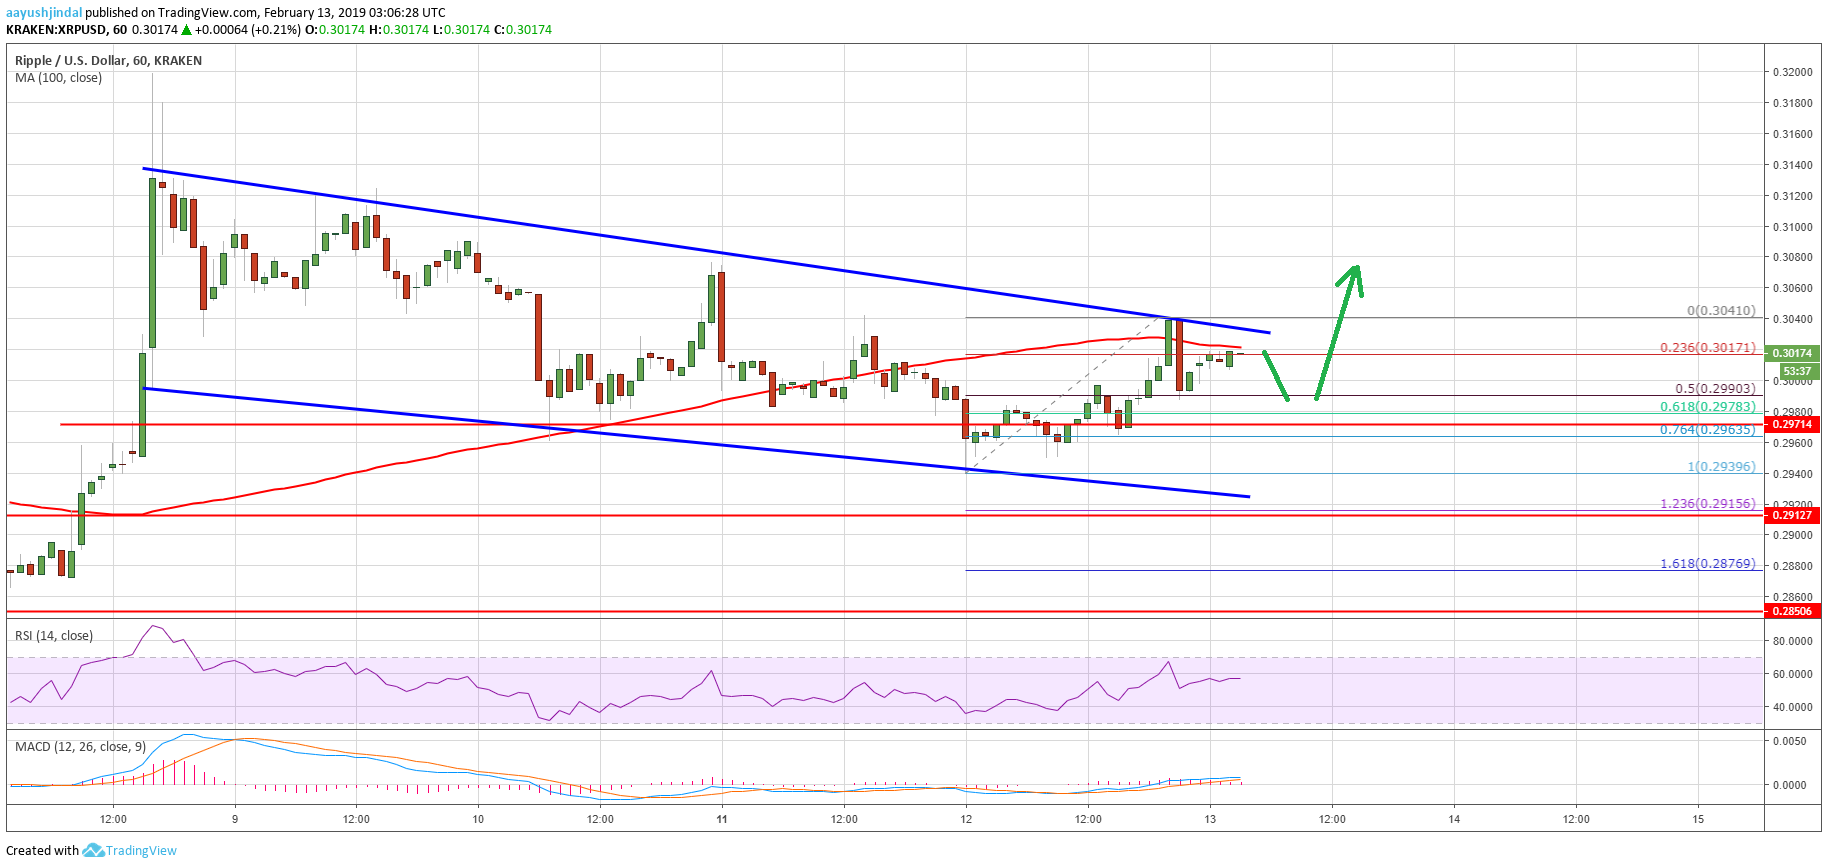

Looking at the chart, ripple price is showing a few positive signs above the $0.2980 support. Should buyers push the price above the $0.3040 resistance, there are chances of more gains towards $0.3060 and $0.3100.
Technical Indicators
Hourly MACD – The MACD for XRP/USD is slightly placed in the bullish zone.
Hourly RSI (Relative Strength Index) – The RSI for XRP/USD is now placed well above the 50 level.
Major Support Level – $0.2980
Major Resistance Level – $0.3040