

- Ripple price is under pressure and it recently broke the $0.2980 support level against the US dollar.
- There is a major bearish trend line formed with resistance near $0.2980 on the hourly chart of the XRP/USD pair (data source from Kraken).
- The pair could accelerate losses if there is a downside break below the $0.2940 support in the near term.
Ripple price declined further and broke key supports against the US Dollar and Bitcoin. XRP/USD is currently at a risk of a downside break below the $0.2940 and $0.2920 supports.
Ripple Price Analysis
Yesterday, we saw a downside reaction in ripple price below the $0.3110 support level against the US Dollar. The XRP/USD pair declined below the $0.3050 and $0.3000 support levels to enter a bearish zone. Later, the price even broke the $0.2980 support and the 100 hourly simple moving average. It tested the $0.2940 support area and later started a short term upside correction. It recovered above the $0.2980 resistance and the $0.3000 level. There was a break above the 23.6% Fib retracement level of the recent decline from the $0.3110 high to $0.2940 low.
However, the price failed to gain momentum above the $0.3000 and $0.3020 levels. There was no test of the 50% Fib retracement level of the recent decline from the $0.3110 high to $0.2940 low. The price remained well below the $0.3025 resistance and the 100 hourly simple moving average. Besides, there is a major bearish trend line formed with resistance near $0.2980 on the hourly chart of the XRP/USD pair. To start a decent recovery, the price must break the trend line, $0.3000, and the 100 hourly SMA. The next key resistances are positioned near $0.3025 and $0.3045.
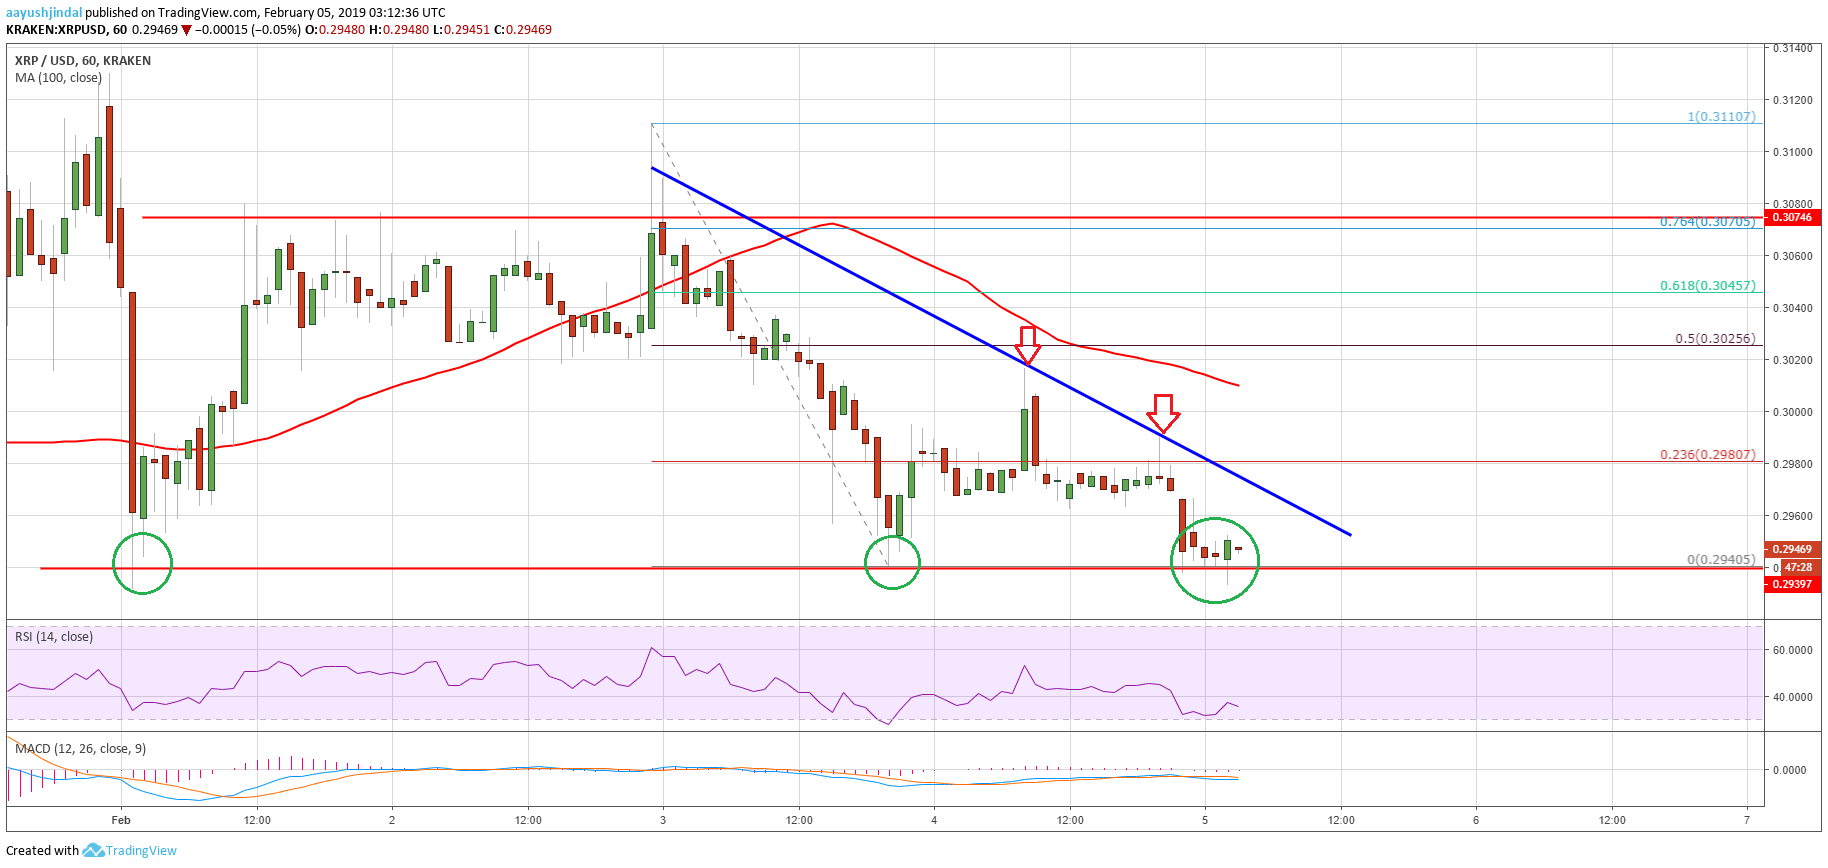

Looking at the chart, ripple price is currently trading near a crucial support at $0.2940. If there is a downside break, the price might accelerate losses below the $0.2920 and $0.2900 levels in the near term.
Technical Indicators
Hourly MACD – The MACD for XRP/USD is currently gaining momentum in the bearish zone.
Hourly RSI (Relative Strength Index) – The RSI for XRP/USD is struggling to recover above the 40 level.
Major Support Level – $0.2940
Major Resistance Level – $0.3025