

- Ripple price failed to break the $0.3380 and $0.3400 resistance levels against the US dollar.
- The price traded lower and broke the $0.3220 and $0.3200 support levels to move into a bearish zone.
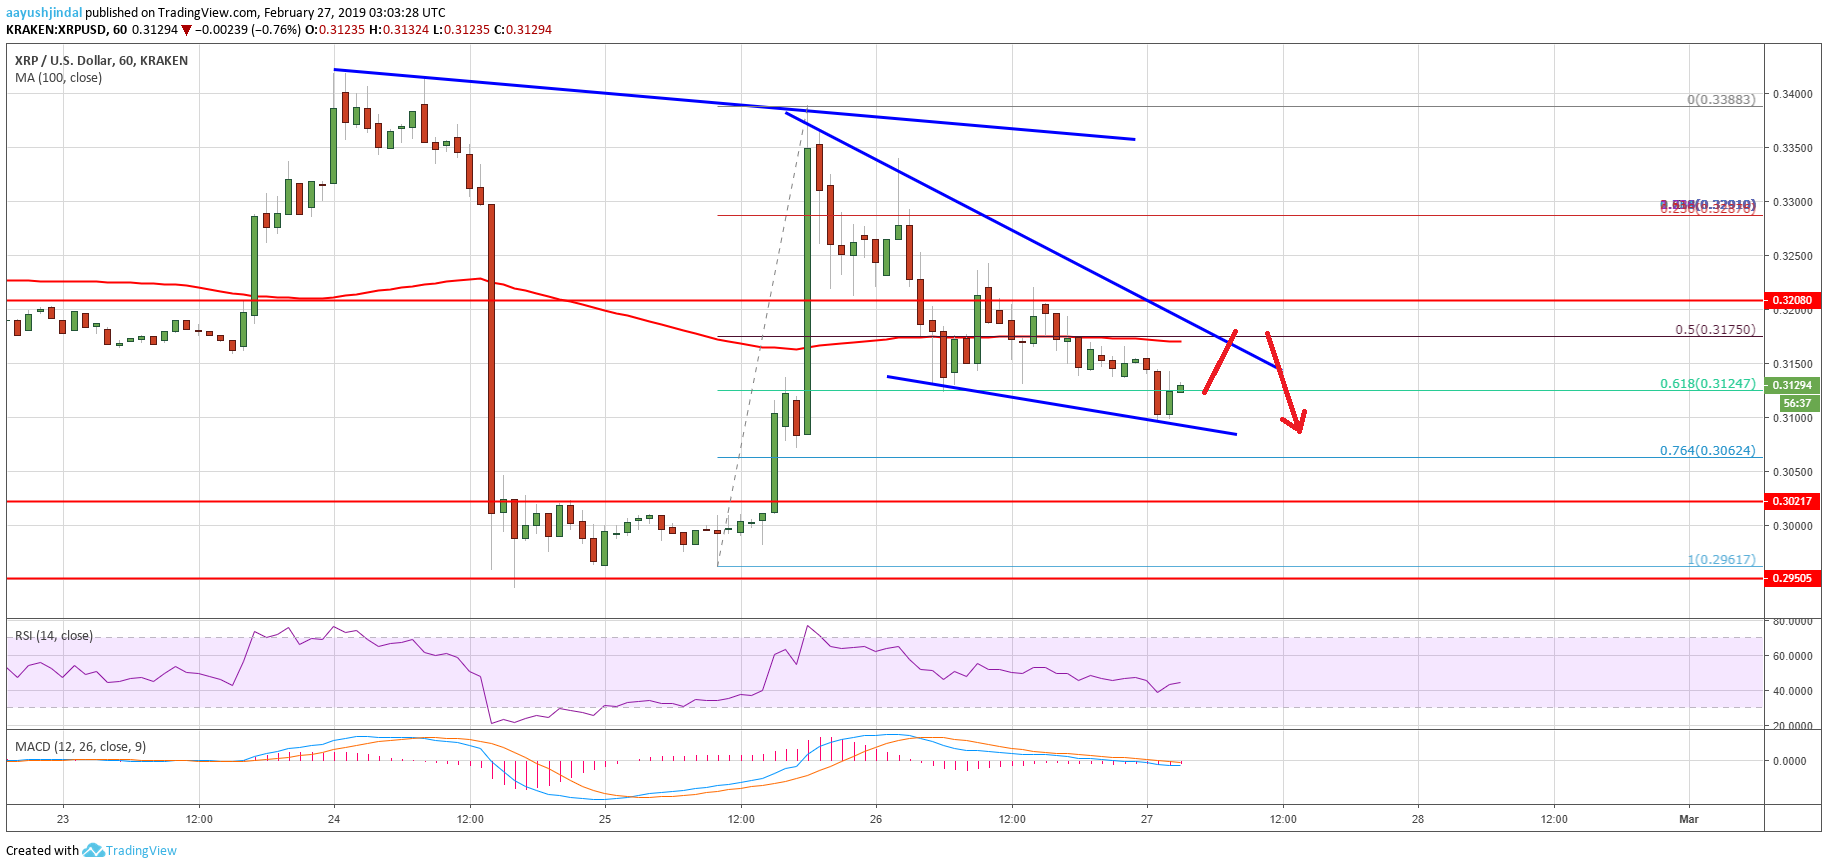
- There is a short term breakout pattern formed with resistance at $0.3155 on the hourly chart of the XRP/USD pair (data source from Kraken).
- The pair could decline further if there is a downside break below the $0.3100 support.
Ripple price rally after the Coinbase Pro listing failed to gain pace against the US Dollar and bitcoin. XRP/USD trimmed most gains and traded below the key $0.3200 support level.
Ripple Price Analysis
Yesterday, we saw a sharp upward move in ripple price above $0.3200 against the US Dollar. The XRP/USD pair even broke the $0.3320 resistance level and the 100 hourly simple moving average. However, the price failed to break the $0.3380 and $0.3400 resistance levels. A fresh decline initiated and the price broke the $0.3320 and $0.3220 support levels. There was even a break below the 50% Fib retracement level of the last leg from the $0.2960 low to $0.3388 high.
It opened the doors for more losses and the price broke the $0.3200 support plus the 100 hourly simple moving average. Recently, the price spiked below $0.3140 and the 61.8% Fib retracement level of the last leg from the $0.2960 low to $0.3388 high. However, the $0.3100 support prevented losses and the price is currently consolidating. Moreover, there is a short term breakout pattern formed with resistance at $0.3155 on the hourly chart of the XRP/USD pair.
The chart suggests that the pair seems to be approaching the next break either below $0.3100 or above $0.3180. On the upside, there are many hurdles near the $0.3180, $0.3200 and $0.3220 levels. A close above $0.3220 could push the price towards the $0.3380 swing high in the near term. On the other hand, if there is a downside break below $0.3100, the price could decline sharply. The next key support is at $0.3020, below which the price may retest $0.3000.

Looking at the chart, ripple price clearly failed to capitalize above the $0.3380 zone. It is currently trading in a bearish zone and it will most likely gain pace below $0.3100. Conversely, buyers need to break the $0.3220 barrier to start a fresh upward move in the coming sessions.
Technical Indicators
Hourly MACD – The MACD for XRP/USD is about to move into the bullish zone, but it is lacking strength.
Hourly RSI (Relative Strength Index) – The RSI for XRP/USD is currently near the 45 level, with a bullish angle.
Major Support Levels – $0.3100, $0.3020 and $0.300.
Major Resistance Levels – $0.3180, $0.3200 and $0.3220.