

- Ripple price rallied sharply above $0.3200 against the US dollar after the Coinbase listing announcement.
- The price traded above the $0.3220 and $0.3300 resistance levels before it faced sellers near $0.3400.
- There is a crucial connecting bearish trend line formed with resistance at $0.3360 on the hourly chart of the XRP/USD pair (data source from Kraken).
- The pair may correct a few points, but dips remain supported above $0.3200.
Ripple price climbed higher sharply against the US Dollar and bitcoin after the positive news of Coinbase listing. XRP/USD tested the $0.3400 resistance and it remains supported for more gains.
Ripple Price Analysis
Recently, we saw a sharp decline in ripple price below the $0.3200 support area against the US Dollar. The XRP/USD pair broke key supports and moved into a bearish zone similar to Ethereum and bitcoin. It even traded below the $0.3000 support before buyers appeared near $0.2960. Later, the price started trading in a range above $0.2980 for the next break. Finally, there was a solid bullish wave the Coinbase listing announcement. Buyers gained paced and broke many key resistances such as $0.3100, $0.3140, $0.3200 and $0.3220.
There was a close above the $0.3200 level and the 100 hourly simple moving average. Besides, the 61.8% Fib retracement level of the last drop from the $0.3420 high to $0.2940 low was breached. The price even broke the $0.3350 resistance and traded close to the $0.3400 resistance. However, there was no follow through above the $0.3385 level and the price failed to test the last high near $0.3420. An intraday high was formed at $0.3388 and the price later corrected lower.
It dipped below the 23.6% Fib retracement level of the recent wave from the $0.2961 low to $0.3388 high. However, there are many supports on the downside near the $0.3220 and $0.3200 level. The 50% Fib retracement level of the recent wave from the $0.2961 low to $0.3388 high is also near the $0.3175 level. Therefore, it seems like dips remain supported above $0.3175 in the near term. On the upside, there is a crucial connecting bearish trend line formed with resistance at $0.3360 on the hourly chart of the XRP/USD pair.
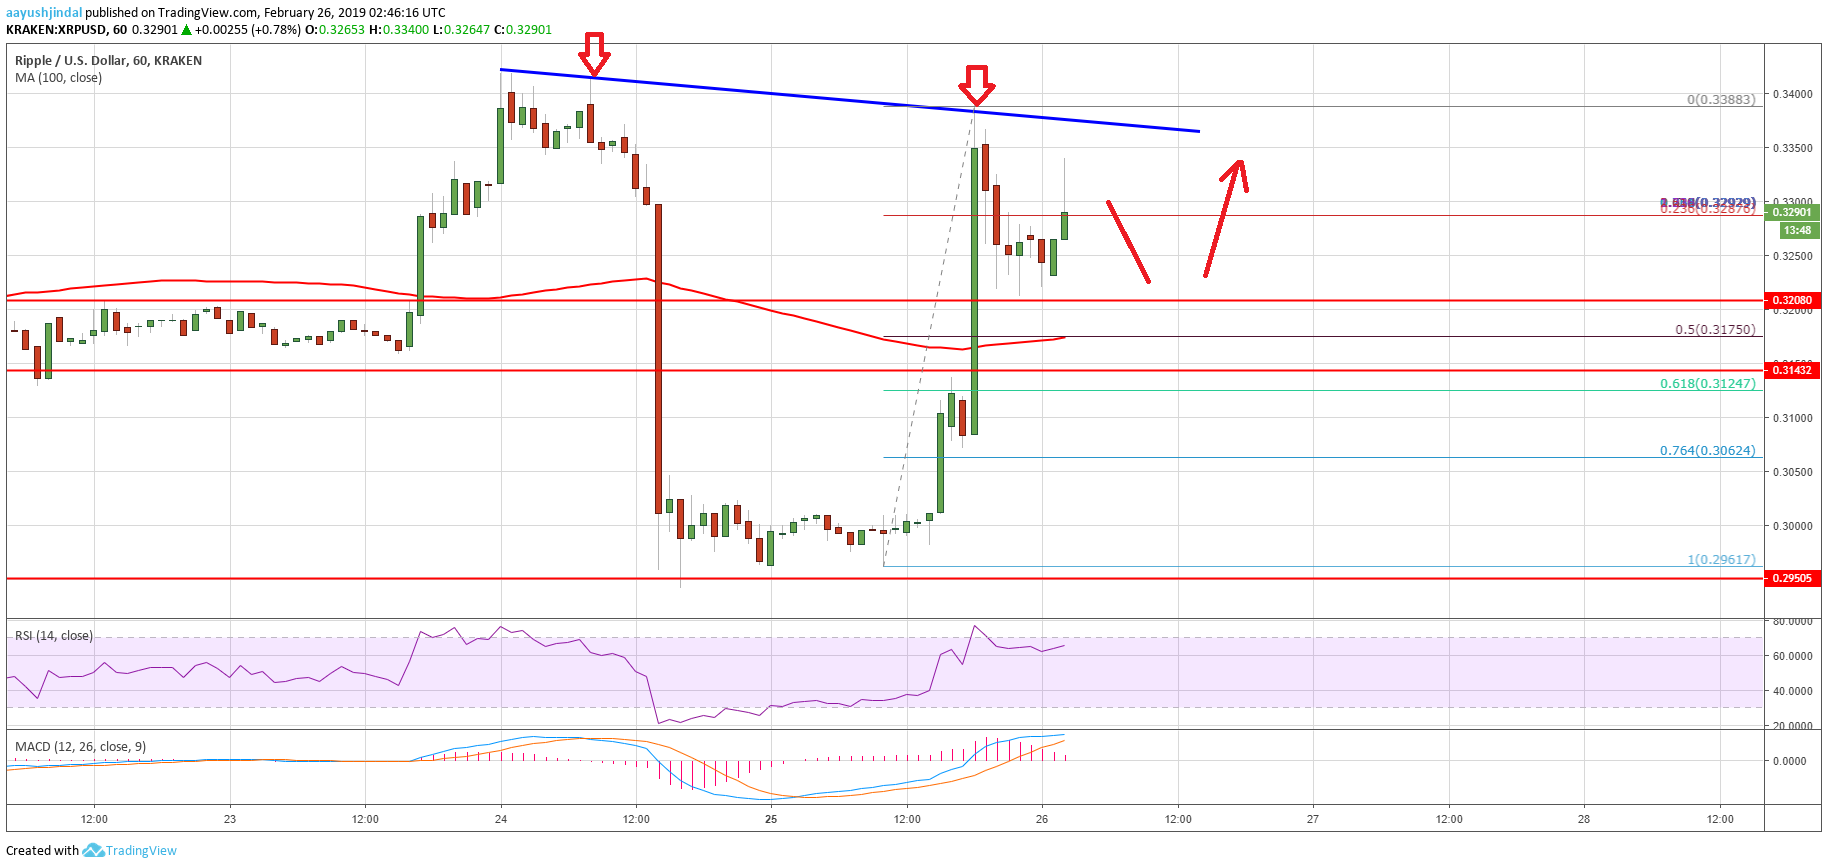

Looking at the chart, ripple price may continue to struggle near the trend line and $0.3400. If there is a successful daily close above $0.3400, it is likely to trigger more gains above the $0.3450 level.
Technical Indicators
Hourly MACD – The MACD for XRP/USD could move back in the bearish zone.
Hourly RSI (Relative Strength Index) – The RSI for XRP/USD is currently placed well above the 60 and 65 levels.
Major Support Levels – $0.3220, $0.3200 and $0.3175.
Major Resistance Levels – $0.3350, $0.3400 and $0.3420.