

Key Highlights
- Ripple price is struggling to move above the $1.0250 level against the US dollar.
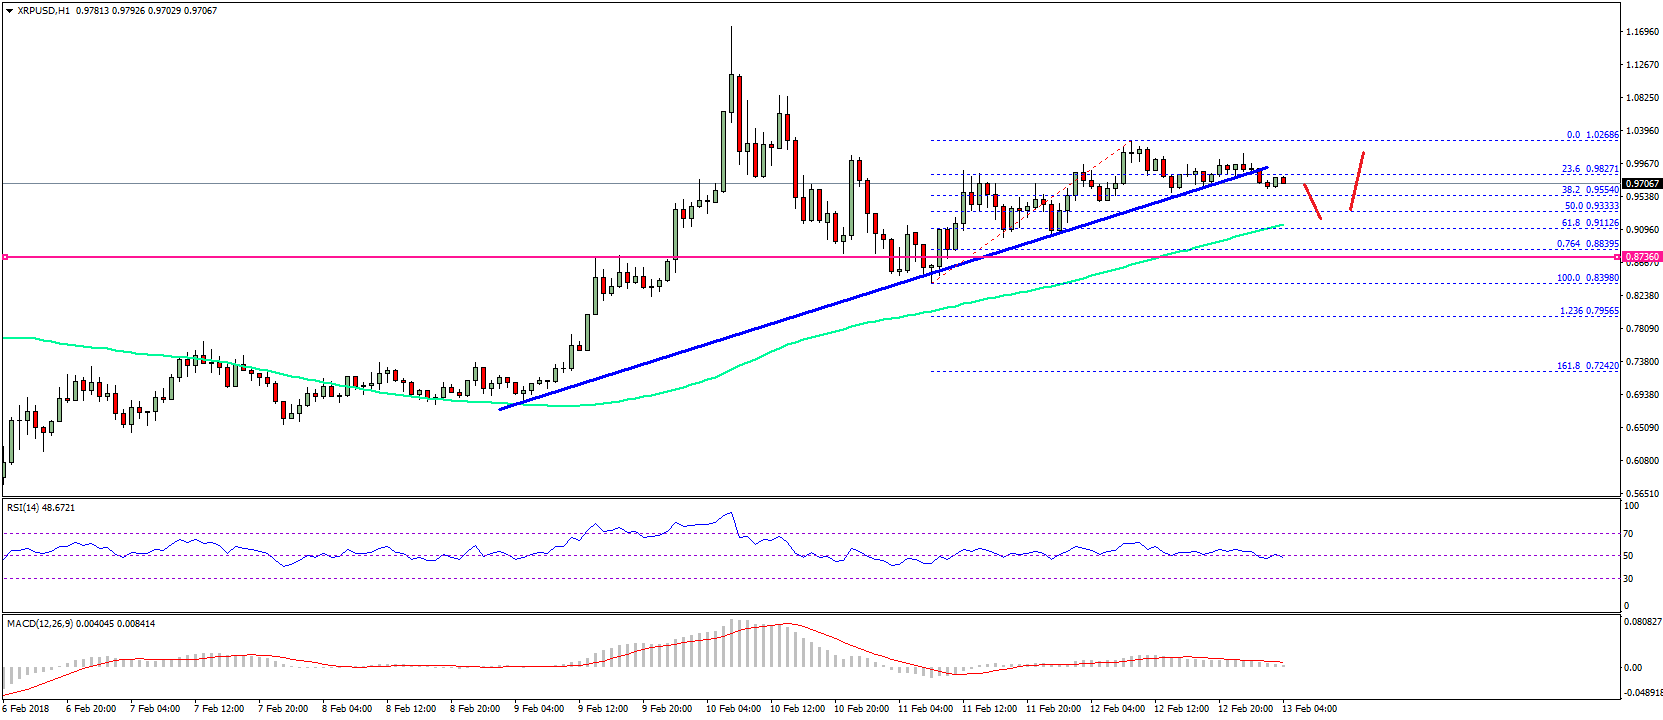
- There was a break below a key bullish trend line with support at $0.9830 on the hourly chart of the XRP/USD pair (data source from SimpleFx).
- The pair could decline further towards the $0.9200 and $0.9000 support levels in the near term.
Ripple price is slowly following a declining path against the US Dollar and Bitcoin. XRP/USD may correct a few points lower with support near $0.9200 and $0.9000.
Ripple Price Trend
Recently, we saw a steady uptrend in Ripple price above the $0.8500 level against the US Dollar. The price moved above the $0.9000 and $0.9500 resistance levels. It also traded above the $1.0000 level and $1.0200. However, it could not gain momentum above the $1.0250 level and later started a downside move. It moved below the 23.6% Fib retracement level of the last wave from the $0.8398 low to $1.0268 high.
More importantly, there was a break below a key bullish trend line with support at $0.9830 on the hourly chart of the XRP/USD pair. It seems like the pair may decline further as long as it is below $1.0000. The next major support on the downside is around the 50% Fib retracement level of the last wave from the $0.8398 low to $1.0268 high at $0.9333. Moreover, the 100 hourly simple moving average is positioned near $0.9200. Therefore, the $0.9200 level is likely to act as a decent support.

Below $0.9200, the $0.9000 level could provide support. On the upside, the price has to settle above $1.0000 and break the $1.0250 resistance to gain upside momentum in the near term.
Looking at the technical indicators:
Hourly MACD – The MACD for XRP/USD is mostly flat with a few bearish signs.
Hourly RSI (Relative Strength Index) – The RSI for XRP/USD has just moved below the 50 level.
Major Support Level – $0.9200
Major Resistance Level – $1.0250
Charts courtesy – SimpleFX