Key Highlights
- Ripple price is struggling to move higher and is currently trading below $1.0850 against the US dollar.
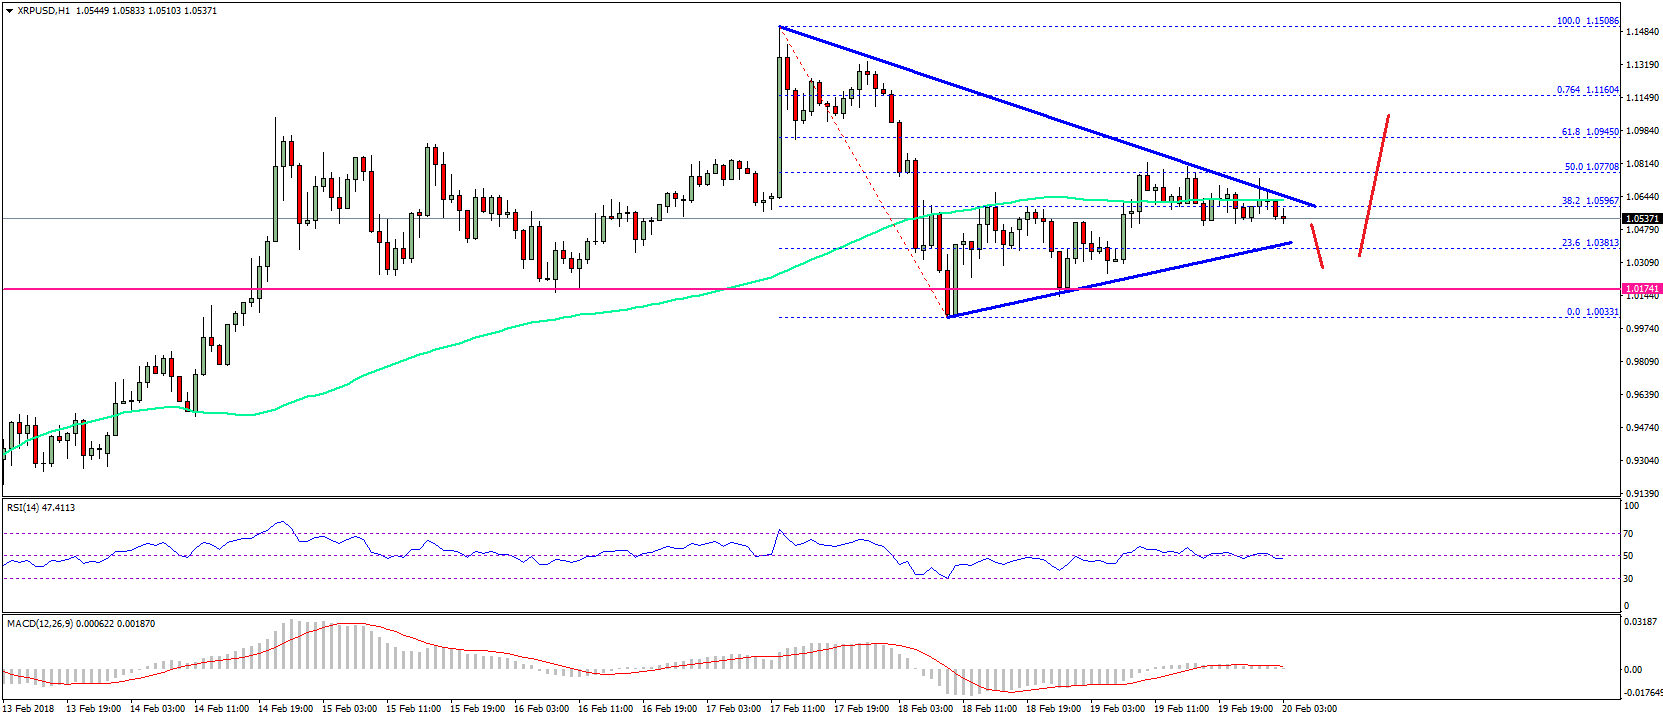
- There is a major contracting triangle pattern forming with resistance at $1.0700 on the hourly chart of the XRP/USD pair (data source from SimpleFx).
- The pair has to move above $1.0700 and the 100 hourly simple moving average to move further higher.
Ripple price is slowly moving away from the bullish zone against the US Dollar and Bitcoin. XRP/USD must break above $1.0700 and the 100 hourly SMA to avoid further declines.
Ripple Price Upside Hurdle
There was no upside break above $1.12 in Ripple price during the past three sessions against the US Dollar. The price started a slow and steady downside move and traded below $1.10. It also traded below the $1.0750 support and the 100 hourly simple moving average. The last upside move not sustainable above the 50% Fib retracement level of the last drop from the 1.1510 swing high to $1.0050 swing low.
There was no hourly close above the $1.10 level, which ignited a downside wave. At the moment, there is a major contracting triangle pattern forming with resistance at $1.0700 on the hourly chart of the XRP/USD pair. The pair is approaching a short-term break either above $1.0700 or below $1.0400. On the upside, above $1.0700, the price could test the 61.8% Fib retracement level of the last drop from the 1.1510 swing high to $1.0050 swing low at $1.0945. Above the mentioned $1.0945, the price may perhaps move above the $1.10 level.

On the flip side, if the pair fails to move above the 100 hourly SMA, it could decline back towards $1.0200 in the near term.
Looking at the technical indicators:
Hourly MACD – The MACD for XRP/USD is now moving in the bearish zone.
Hourly RSI (Relative Strength Index) – The RSI for XRP/USD has moved below the 50 level.
Major Support Level – $1.0400
Major Resistance Level – $1.0700
Charts courtesy – SimpleFX