

Key Highlights
- Ripple price declined further and failed to stay above the $0.2300 level against the US Dollar.
- Yesterday’s highlighted major bearish trend line with current resistance at $0.2400 is intact on the hourly chart of the XRP/USD pair (data source from Kraken).
- The pair might continue to struggle and it will be difficult for buyers to keep the price above $0.2200.
Ripple price extended declines against the US Dollar and Bitcoin. XRP/USD is currently testing $0.2200 and struggling to hold the stated level.
Ripple Price Decline
There were further losses in Ripple price from the $0.2400 swing high against the US Dollar. The price slowly and steadily moved down below the $0.2350 and $0.2300 support levels. It traded close to the $0.2200 level and formed a low at $0.2190. Later, there was an upside correction and the price moved above the 23.6% Fib retracement level of the last decline from the $0.2600 high to $0.2190 low.
However, the upside move was capped by the $0.2350 resistance. Moreover, the 38.2% Fib retracement level of the last decline from the $0.2600 high to $0.2190 low also acted as a resistance. XRP declined once again and is currently trading near the $0.2200 support area. On the upside, yesterday’s highlighted major bearish trend line with current resistance at $0.2400 is intact on the hourly chart of the XRP/USD pair. The trend line resistance at $0.2400 is also around the 100 hourly simple moving average.
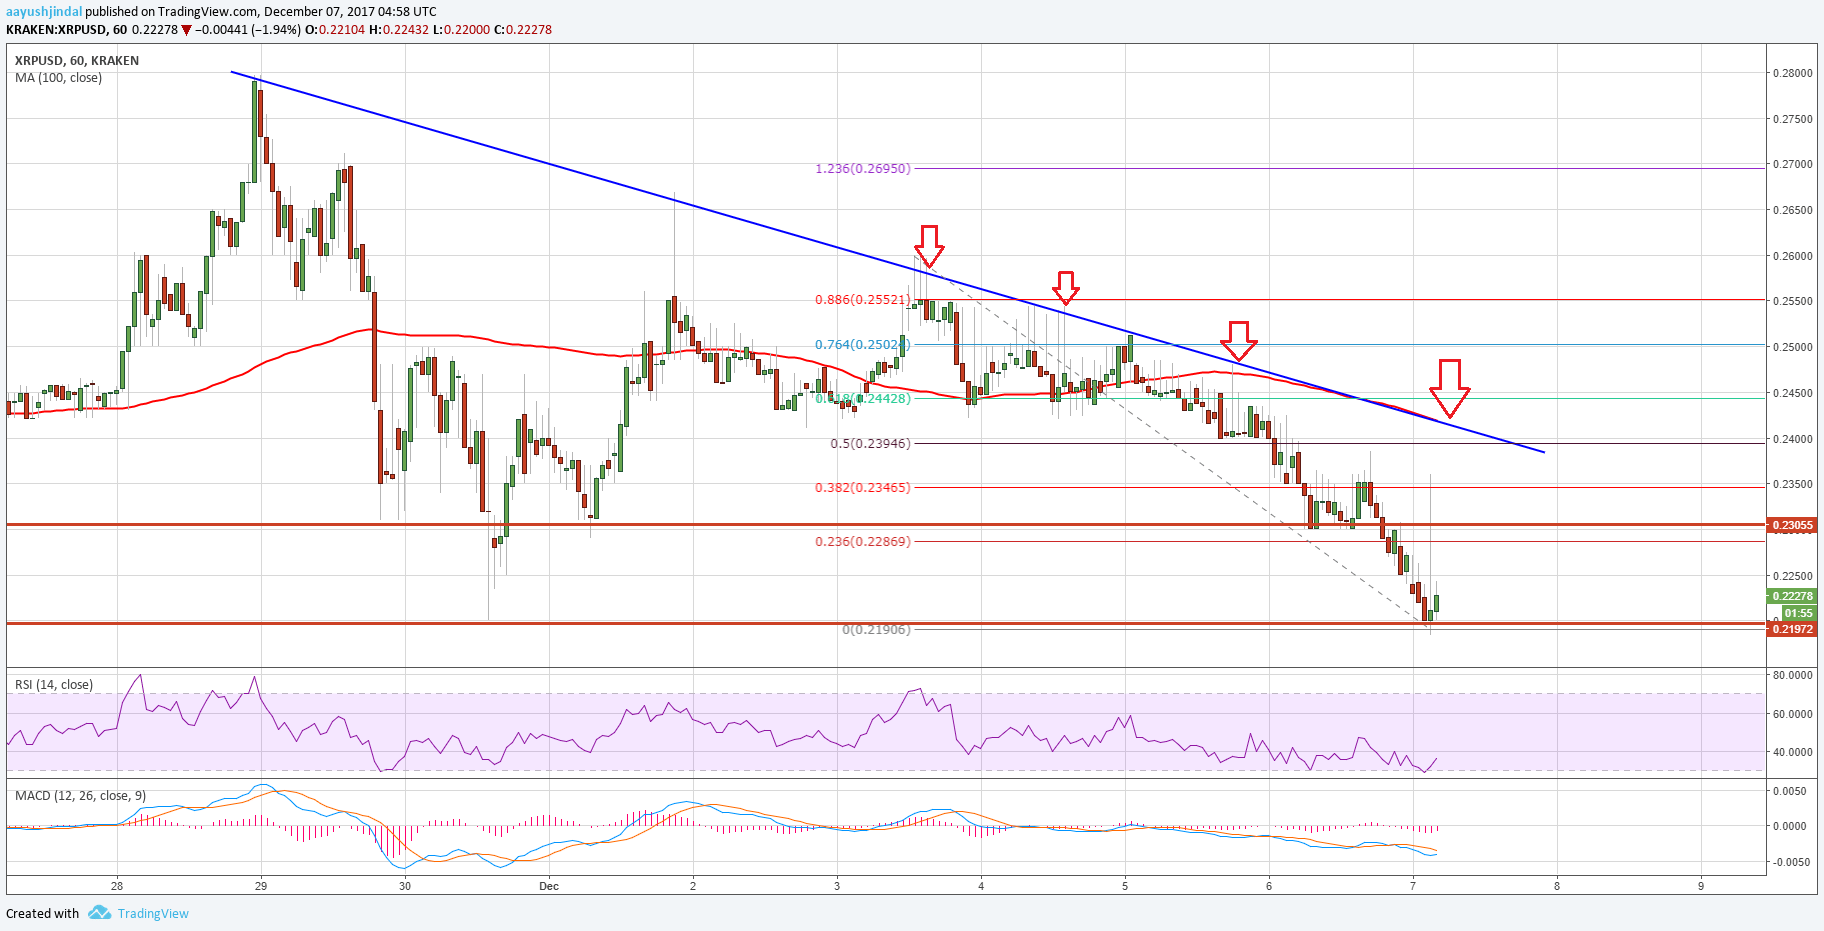
Therefore, the $0.2350 and $0.2400 levels are important resistances on the upside. As long as the price is below the $2400, there can be more declines in XRP/USD in the short term.
Looking at the technical indicators:
Hourly MACD – The MACD for XRP/USD is gaining pace in the bearish zone and is showing a lot of negative signs.
Hourly RSI (Relative Strength Index) – The RSI for XRP/USD is now below the 40 level and is in the bearish zone.
Major Support Level – $0.2200
Major Resistance Level – $0.2400
Charts courtesy – Trading View, Kraken