Key Highlights
- Ripple price started an upside correction and moved above the $0.6500 level against the US dollar.
- There is a crucial bearish trend line forming with resistance at $0.7200 on the hourly chart of the XRP/USD pair (data source from Kraken).
- The pair must move above the $0.7200 resistance and the 100 hourly simple moving average to gain momentum.
Ripple price is slowly recovering against the US Dollar and Bitcoin. XRP/USD has to move above the $0.7200-0.7300 zone to recover further in the near term.
Ripple Price Upside Hurdle
There was a major decline noted yesterday towards $0.6200 in Ripple price against the US Dollar. The price traded as low as $0.6260 and later started an upside correction. It moved above the $0.6500 resistance to start an upside recovery. It also traded above the 38.2% Fib retracement level of the last drop from the $0.7899 high to $0.6267 swing low.
However, the upside move was protected by a major resistance near $0.7080-0.7100. The stated $0.7080 level was a support earlier and now it is acting as a resistance. Moreover, the 50% Fib retracement level of the last drop from the $0.7899 high to $0.6267 swing low also protected losses. At the moment, the price is consolidating around the $0.7000 level and is preparing for the next move. To the topside, there is a crucial bearish trend line forming with resistance at $0.7200 on the hourly chart of the XRP/USD pair.
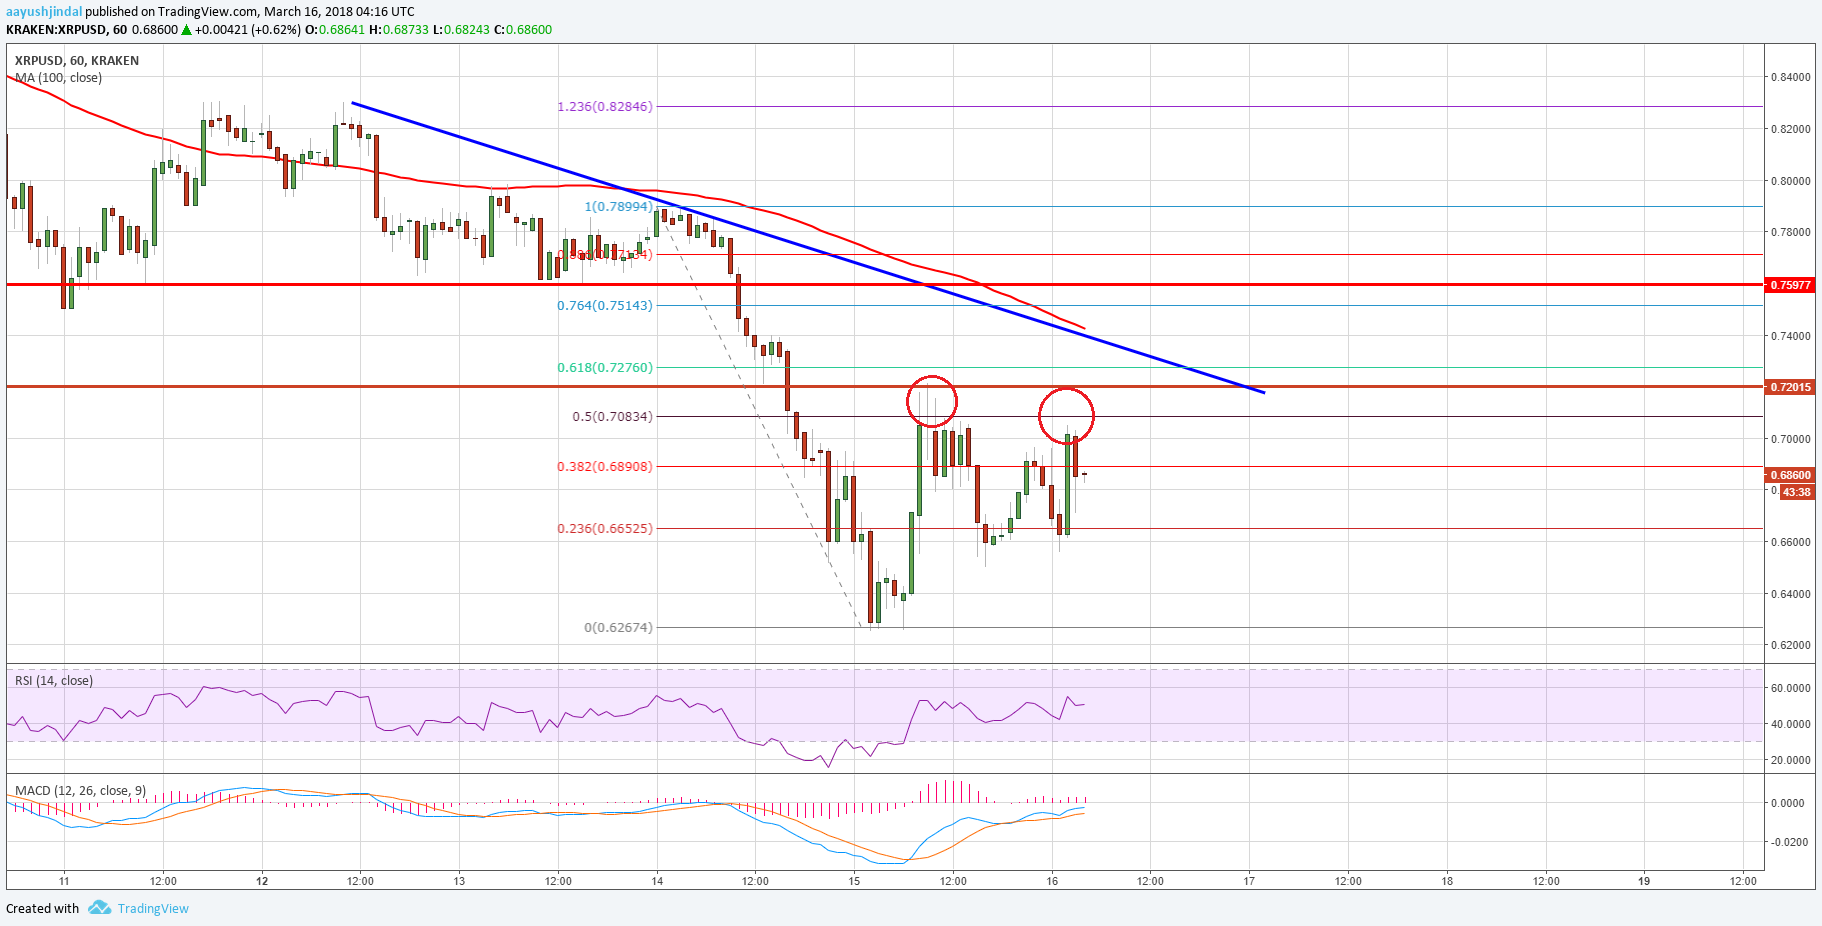

The 100 hourly simple moving average is also positioned around the $0.7100 level. Therefore, a break above the $0.7080 and $0.7100 levels is must for further recoveries. On the downside, the $0.6500 level is a decent support followed by the $0.6200 swing low.
Looking at the technical indicators:
Hourly MACD – The MACD for XRP/USD is slowly moving in the bullish zone.
Hourly RSI (Relative Strength Index) – The RSI for XRP/USD is currently just above the 50 level.
Major Support Level – $0.6500
Major Resistance Level – $0.7080
Charts courtesy – Trading View