Key Highlights
- Ripple price failed to remain in a bullish zone and broke the $0.9450 support against the US dollar.
- Yesterday’s short-term connecting bullish trend line with support at $0.9400 was broken on the hourly chart of the XRP/USD pair (data source from Kraken).
- The pair is currently under pressure and it may fall back towards the $0.8800.
Ripple price declined further in the bearish zone against the US Dollar and Bitcoin. XRP/USD may accelerate declines towards or below $0.8800.
Ripple Price Decline
There was no recovery above $1.00 yesterday in Ripple price against the US Dollar. The price extended declines and moved below a major support area near $0.9400. The decline was substantial as the price closed below the $0.9200 support as well. There was even a close below the 100 hourly simple moving average and the price traded as low as $0.8928.
During the downside move, yesterday’s short-term connecting bullish trend line with support at $0.9400 was broken on the hourly chart of the XRP/USD pair. It opened the doors for more gains and the price is now at a risk of more declined below $0.8900. An initial resistance on the upside is around the 23.6% Fib retracement level of the last decline from the $0.9802 high to $0.8928 low. There are many hurdles on the upside near the $0.9400 level and the 100 hourly SMA. Moreover, the 50% Fib retracement level of the last decline from the $0.9802 high to $0.8928 low is at $0.9356.
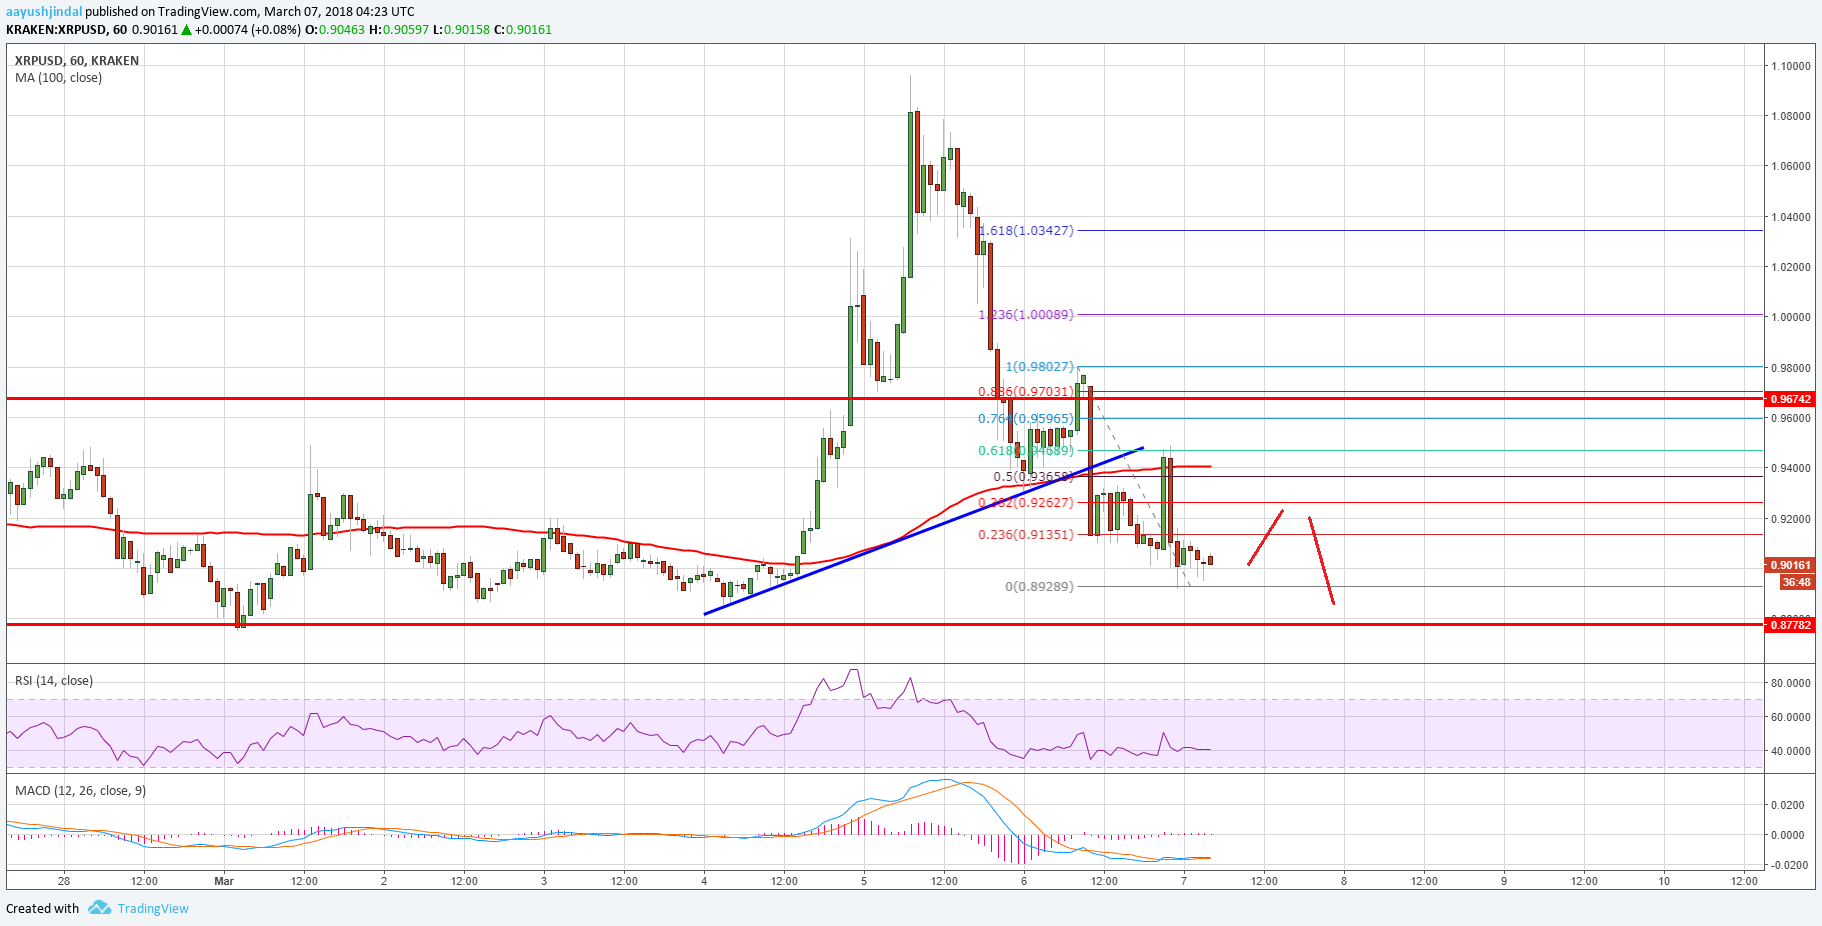

On the downside, the recent low of $0.8928 is a short term support. A break below the mentioned level could push the price towards $0.8800. Any further losses below $0.8800 could be very bearish for XRP in the near term.
Looking at the technical indicators:
Hourly MACD – The MACD for XRP/USD is placed nicely in the bearish zone.
Hourly RSI (Relative Strength Index) – The RSI for XRP/USD is currently well below the 50 level.
Major Support Level – $0.8800
Major Resistance Level – $0.9400
Charts courtesy – Trading View