
Key Highlights
- Ripple price remained in a bearish trend and it traded below the $1.60 support against the US Dollar.
- This week’s highlighted major bearish trend line with current resistance at $1.85 is preventing upsides on the hourly chart of the XRP/USD pair (data source from Kraken).
- The price remains at a risk of more losses as long as it is below the $1.80 level.
Ripple price declined further against the US Dollar and Bitcoin. XRP/USD tested the $1.50 level and it is currently placed in the bearish zone for more declines.
Ripple Price Decline
There was no respite for Ripple price as it extended declines below the $1.75 level against the US Dollar. The price moved down and broke the $1.60 support level as well to trade towards $1.50. A low was formed at $1.5002 and it seems like the current bearish pressure is here to stay. A tiny recovery is underway from $1.50. XRP is currently testing the 23.6% Fib retracement level of the last drop from the $2.05 high to $1.50 low.
There are many resistances on the upside near the $1.75 and $1.80 level. An initial resistance is around the 50% Fib retracement level of the last drop from the $2.05 high to $1.50 low. Moreover, this week’s highlighted major bearish trend line with current resistance at $1.85 is preventing upsides on the hourly chart of the XRP/USD pair. Therefore, there is a clear major resistance forming near $1.80. A break above the $1.80-1.85 levels is needed for buyers to take back the lost control.
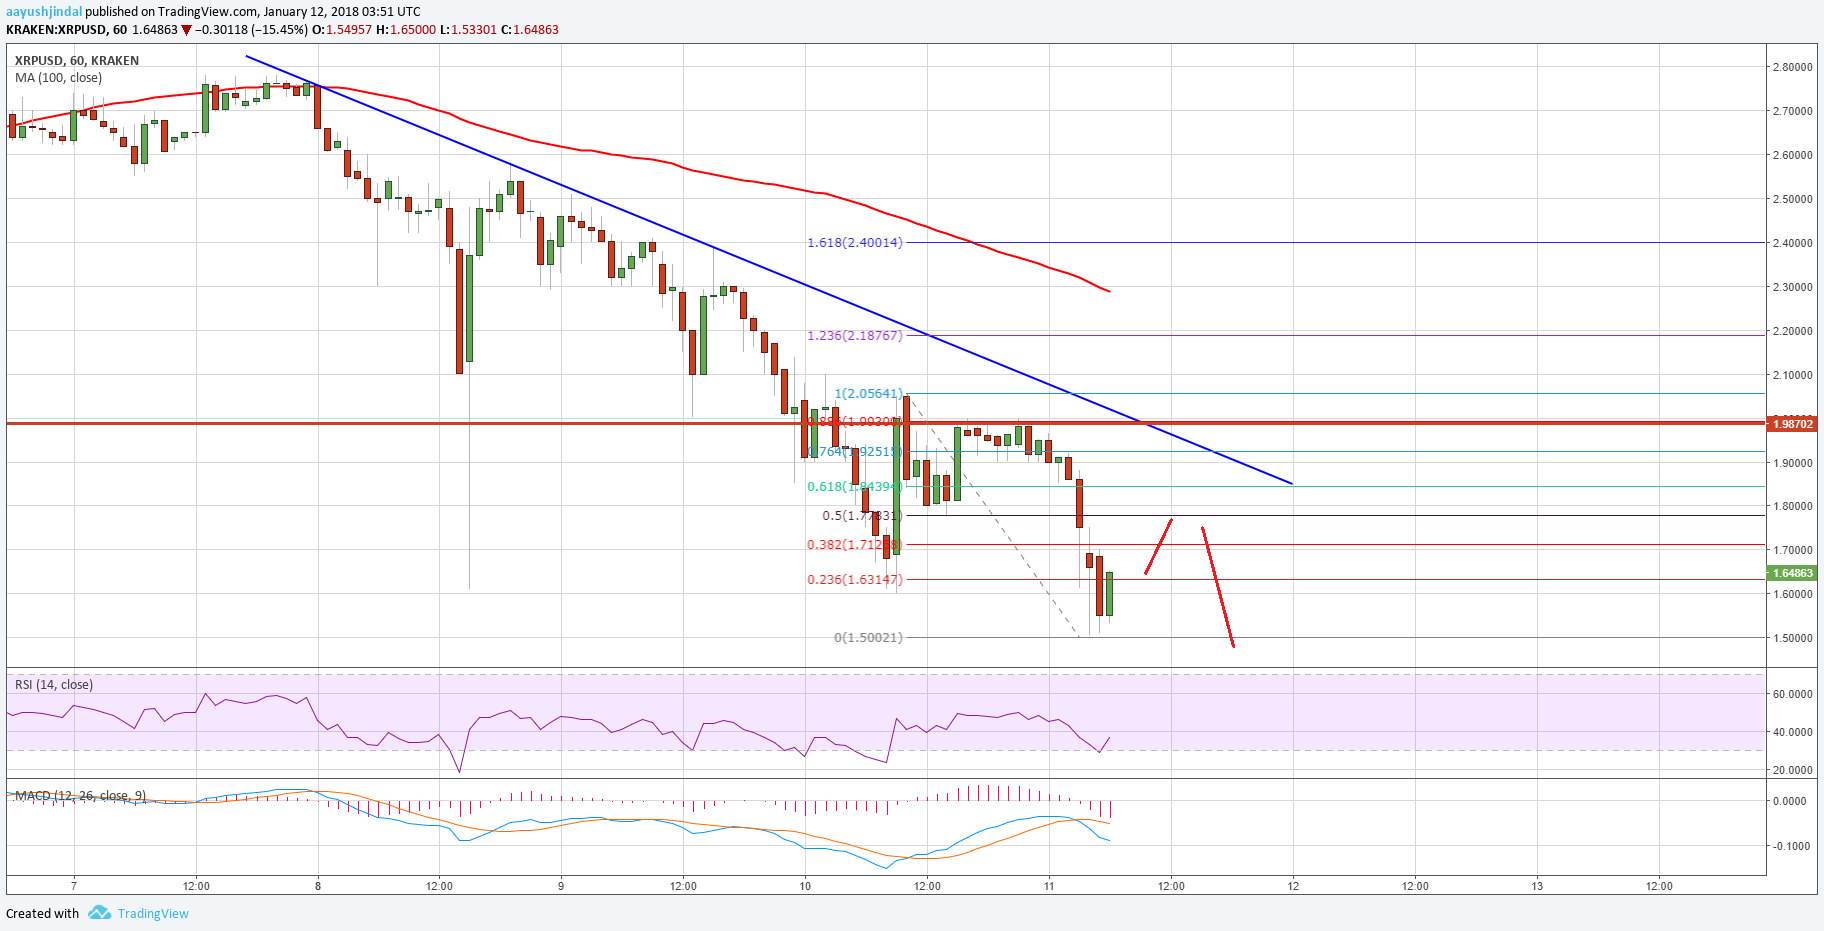

On the downside, the recent low of $1.50 is a decent support. XRP must hold $1.50 to avoid further declines toward $1.25 in the near term.
Looking at the technical indicators:
Hourly MACD – The MACD for XRP/USD is currently in the bearish zone.
Hourly RSI (Relative Strength Index) – The RSI for XRP/USD is recovering from the 30 level.
Major Support Level – $1.50
Major Resistance Level – $1.85
Charts courtesy – Trading View, Kraken