
Key Highlights
- Ripple price is moving higher once again and is currently above the $2.00 handle against the US Dollar.
- There is a crucial bullish trend line forming with support at $2.1000 on the hourly chart of the XRP/USD pair (data source from Kraken).
- The pair might continue to move higher and it could even break the $2.40 resistance in the near term.
Ripple price is moving nicely higher against the US Dollar and Bitcoin. XRP/USD is gaining pace towards $2.40 and it may soon break it.
Ripple Price Trend
There was a slow and steady rise in Ripple price from the $1.9000 swing low against the US Dollar. The price was able to move back above the $2.00 hurdle and is currently placed nicely in the bullish zone. There was also a break above the 61.8% Fib retracement level of the last drop from the $2.50 high to $1.60 low. It has opened the doors for more gains and the price is likely to towards $2.50 in the near term.
On the downside, there is a crucial bullish trend line forming with support at $2.1000 on the hourly chart of the XRP/USD pair. The pair is currently testing the 23.6% Fib retracement level of the last wave from the $1.82 low to $2.39 high. However, there is a chance of it testing the $2.10 support area in the near term. The mentioned support is around the 50% Fib retracement level of the last wave from the $1.82 low to $2.39 high. Therefore, any major correction from the current levels toward $2.10 and $2.00 remains supported.
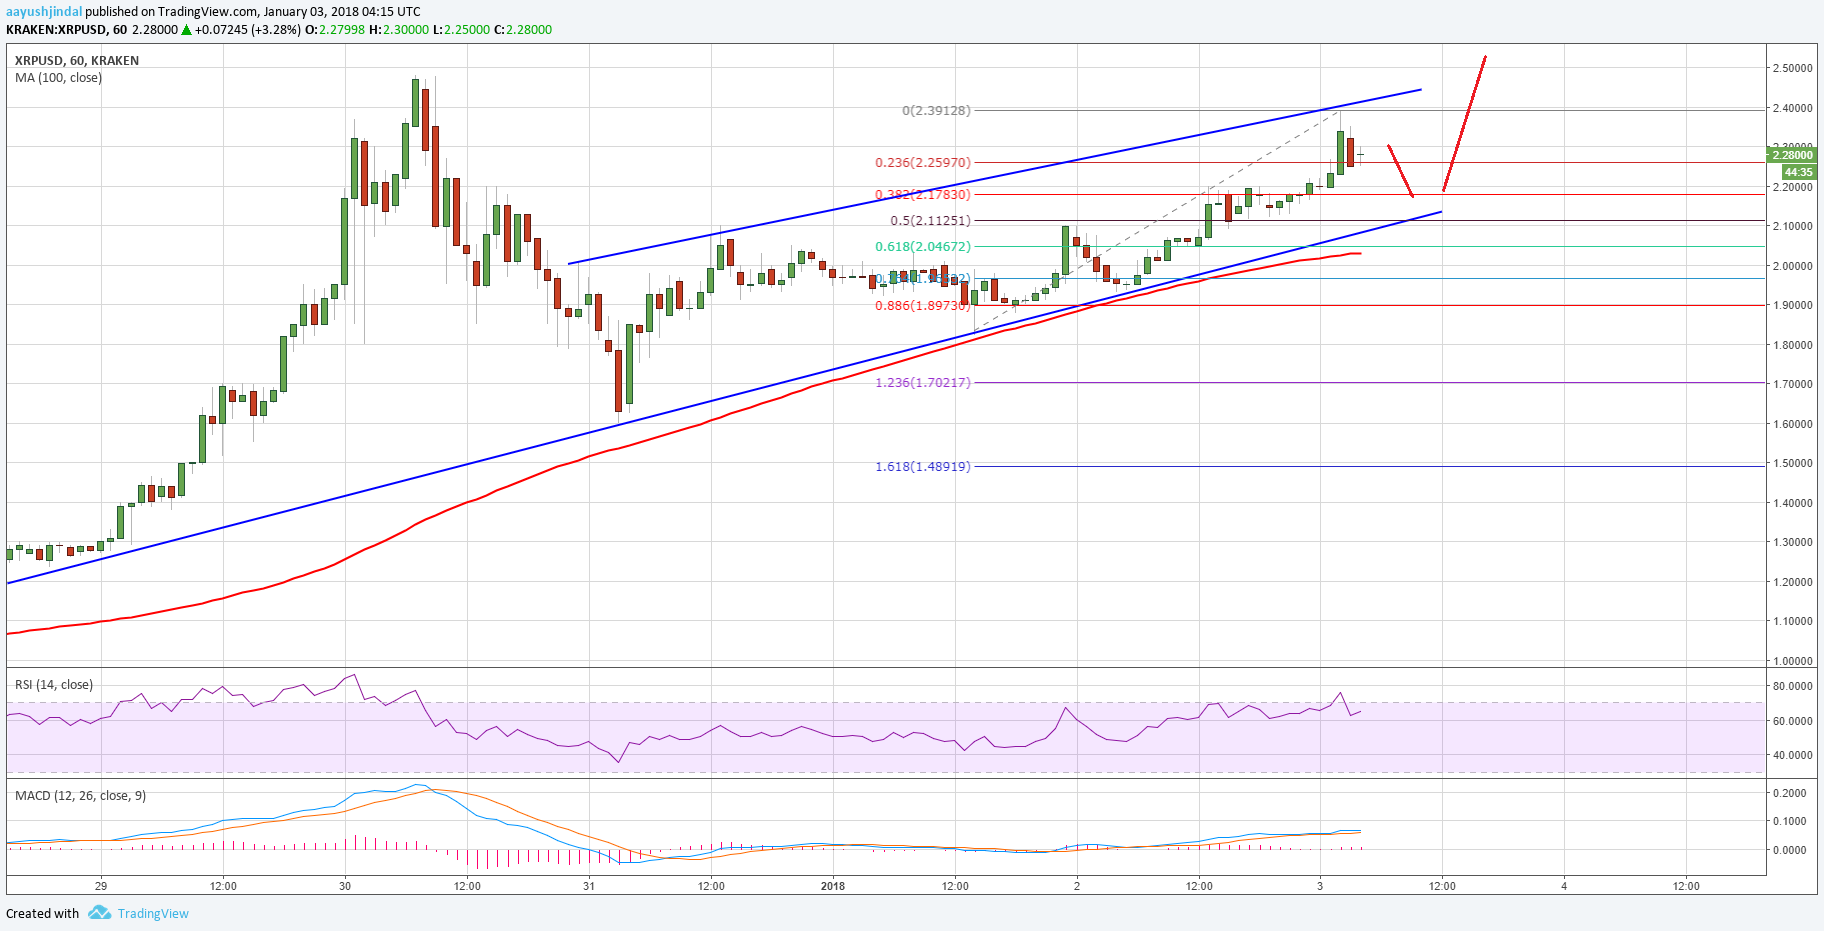

On the upside, a break above the $2.40 would open the doors for an acceleration towards the $2.50 level.
Looking at the technical indicators:
Hourly MACD – The MACD for XRP/USD is slowly moving in the bullish zone.
Hourly RSI (Relative Strength Index) – The RSI for XRP/USD is placed nicely above the 60 level.
Major Support Level – $2.1000
Major Resistance Level – $2.4000
Charts courtesy – Trading View, Kraken