Key Highlights
- Ripple price was able to move above the $0.8400 resistance against the US dollar.
- There was a break above a significant bearish trend line with resistance at $0.8450 on the hourly chart of the XRP/USD pair (data source from SimpleFx).
- The pair is now placed nicely above the $0.8600 support and the 100 hourly simple moving average.
Ripple price is gaining pace against the US Dollar and Bitcoin. XRP/USD seems to be back in the bullish zone with resistances on the upside at $0.8900 and $0.9000.
Ripple Price Support
There was a support base formed in Ripple price above the $0.8200 level against the US Dollar. The price started an upside move and succeeded in breaking the $0.8400 resistance. There was also a break above the 50% Fib retracement level of the last decline from the $0.9320 swing high to $0.8195 low. More importantly, there was a break above a significant bearish trend line with resistance at $0.8450 on the hourly chart of the XRP/USD pair.
The pair climbed higher and it was able to settle above the $0.8600 support and the 100 hourly simple moving average. The upside move was stalled near the 61.8% Fib retracement level of the last decline from the $0.9320 swing high to $0.8195 low. At the moment, the price is currently consolidating in a range above the $0.8600 support. The broken resistance at $0.8600 and the 100 hourly SMA are acting as a supports and are preventing declines.
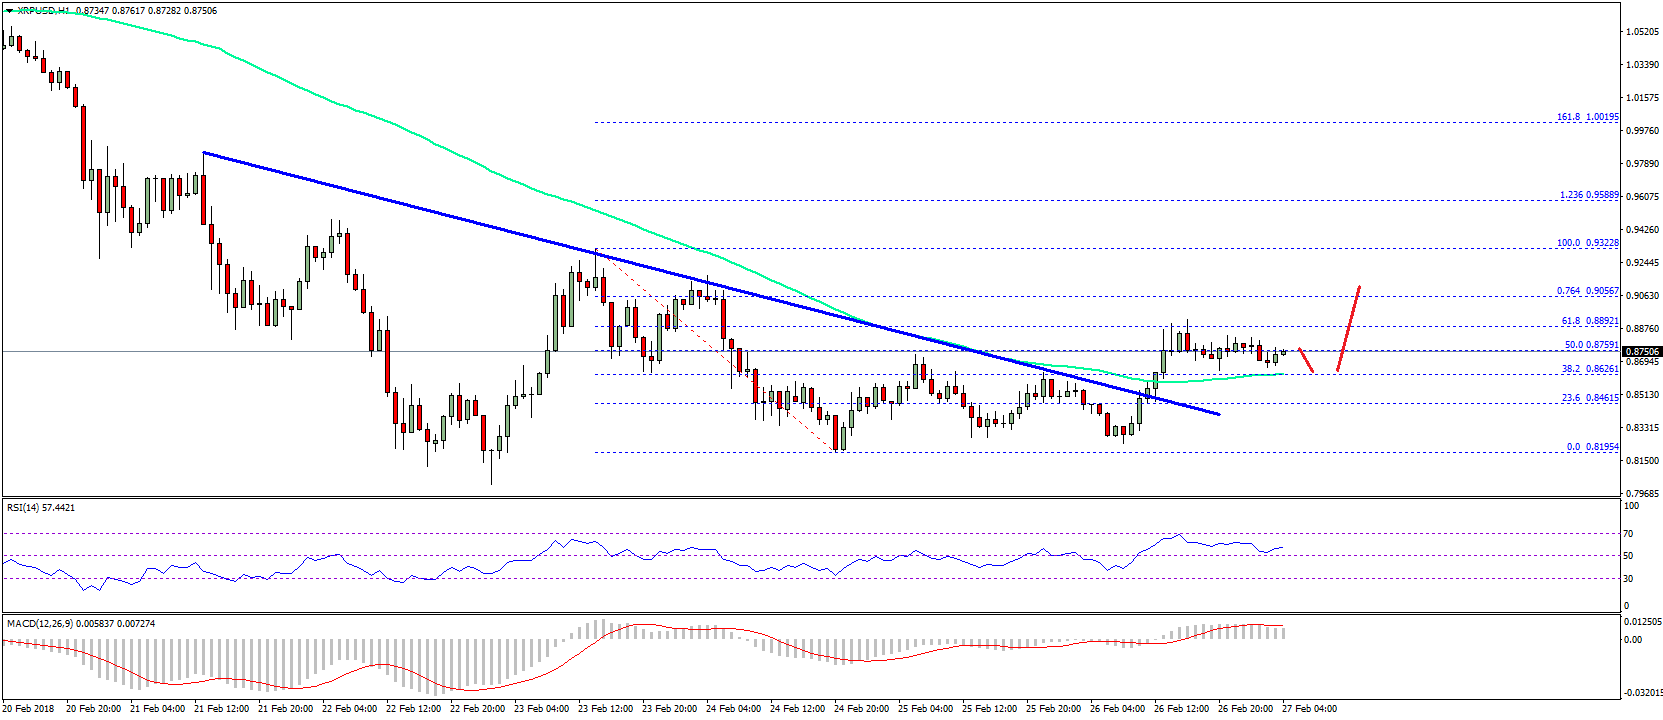

As long as the price is above $0.8600 and the 100 hourly SMA, there could an upside move in XRP/USD. A break above the $0.8900 and $0.9000 resistance levels could clear the path for more gains.
Looking at the technical indicators:
Hourly MACD – The MACD for XRP/USD is now back in the bullish zone.
Hourly RSI (Relative Strength Index) – The RSI for XRP/USD is currently well above the 50 level.
Major Support Level – $0.8600
Major Resistance Level – $0.9000
Charts courtesy – SimpleFX